Archived News
Stock Talk with Joe Rabil1w ago
What Rising Volatility Means to the Current Market
On this week's edition of Stock Talk with Joe Rabil, Joe explains how he uses a rising volatility condition to signal increased risk Read More
The Final Bar1w ago
Is the S&P 500 Forming a Bear Flag Pattern?
In this edition of StockCharts TV's The Final Bar, Dave focuses in on price pattern analysis for the S&P 500, then reflects on the emergence of defensive sectors like consumer staples. He also recaps earnings movers, including DIS, SHOP, and more Read More
Members Only
Martin Pring's Market Roundup1w ago
NYSE and Global A/D Lines Trade at New All-Time Highs
The magnitude and duration of corrections are largely determined by the direction of the prevailing primary trend. If it's bearish, they tend to be more severe and last longer Read More
Don't Ignore This Chart!1w ago

Why Novo Nordisk's Stock Price Recovery Makes It a Promising Buy
Novo Nordisk (NVO) reported Q1 earnings on May 2. Even though it was a positive report, sales of its weight-loss drug Wegovy came in below expectations, causing the NVO stock price to fall lower Read More
The Final Bar1w ago
The Market Breadth Indicator You Should Be Following
In this edition of StockCharts TV's The Final Bar, Dave recaps another strong day for stocks as the S&P 500 regains its 50-day moving average Read More
Trading Places with Tom Bowley1w ago
Here's My Long-Term Perspective on U.S. Stocks
EB Weekly Market Recap Video If you haven't seen our latest weekend recording, it's now available HERE at YouTube.com. Sample - EB Weekly Market Report This is a sample of our Weekly Market Report that is sent to EB members every Monday Read More
DecisionPoint1w ago
DP Trading Room: Two Industry Groups To Watch!
Today Erin uncovers two industry groups that are showing strength and potential in the short term. She takes a look "Under the Hood" to reveal participation and trends that are quite bullish Read More
GoNoGo Charts1w ago
DEFENSE TRIES TO HELP EQUITIES MOVE OFF LOWS
Good morning and welcome to this week's Flight Path. The equity "NoGo" trend struggled this week as prices climbed from lows. We see an amber "Go Fish" bar as the market tries to understand the trend Read More
Trading Places with Tom Bowley1w ago
It's May, So Should We Go Away?
We've all heard that popular Wall Street adage, "Go away in May", right? It's cute and it rhymes, so why wouldn't we make the HUGE decision to liquidate all of our stock holdings? Did I mention it rhymes? One of the biggest disservices to investors everywhere is the "al Read More
Analyzing India2w ago
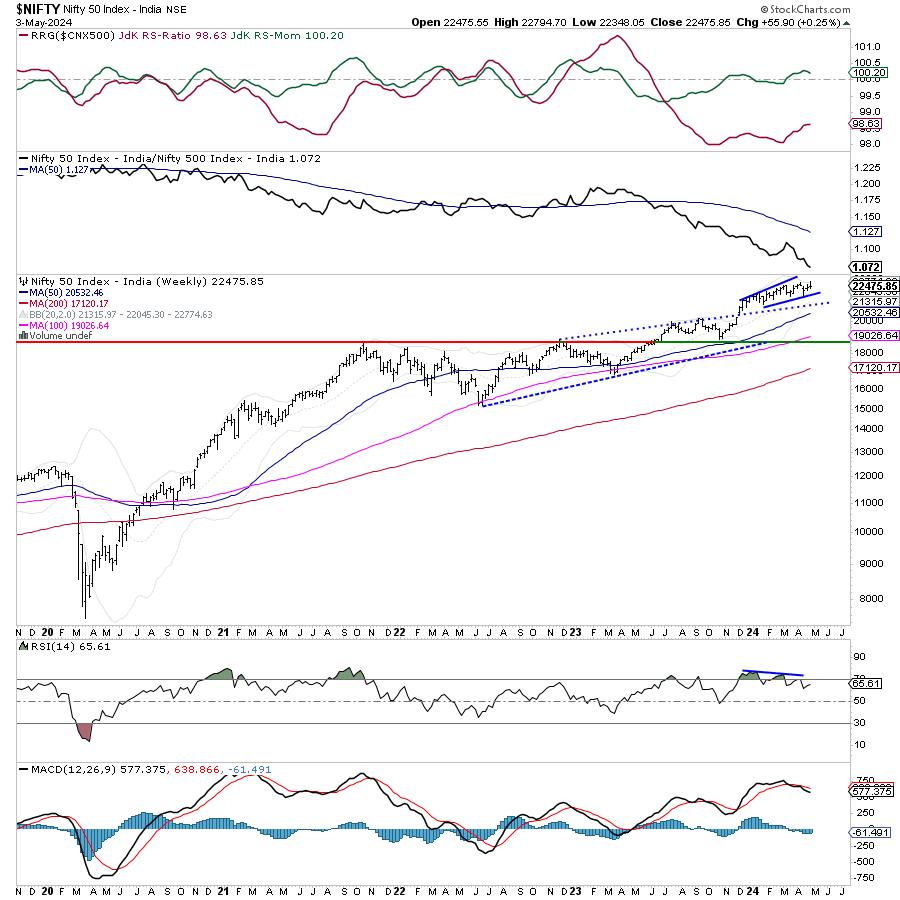
Week Ahead: NIFTY Stays Vulnerable to Disruption of Primary Trend; Volatility Likely to Stay
The markets traded in a much wider range in the past trading week. Over the past few days, we had seen the markets and the VIX inching higher, i.e. moving in the same direction Read More
The MEM Edge2w ago
MEM TV: NVIDA is Setting Up To SURGE
In this episode of StockCharts TV's The MEM Edge, Mary Ellen reviews the key drivers for this week's volatile period, including Core PCE and GDP numbers. She takes a look at where the S&P 500 and NASDAQ closed for the week and whether it's safe to put new money to work Read More
Art's Charts2w ago
Is this a Dead-Cat Bounce or a Bounce with Legs?
Stocks fell sharply into late April and then rebounded over the last two weeks. SPY fell 5.34% from March 28th to April 19th and then rebounded with a 3.26% gain the last two weeks Read More
ChartWatchers2w ago
Technology Stocks Back In the Lead: Are Inflation Fears Behind Us?
The weaker-than-expected jobs report gave the stock market some direction, a nice treat before the 150th Kentucky Derby. Job growth slowed, and the unemployment rate ticked up to 3.9%. If this trend continues, the market may price in more than one interest rate cut this year Read More
The Final Bar2w ago
Key Breadth Indicator Flashes Buy Signal for Nasdaq 100
In this edition of StockCharts TV's The Final Bar, Dave opens The Final Bar mailbag to answer viewer questions on the Nasdaq Bullish Percent Index, the value of long-term technical analysis techniques, how sentiment indicators relate to the market trend, and how the CMT program h Read More
The Mindful Investor2w ago
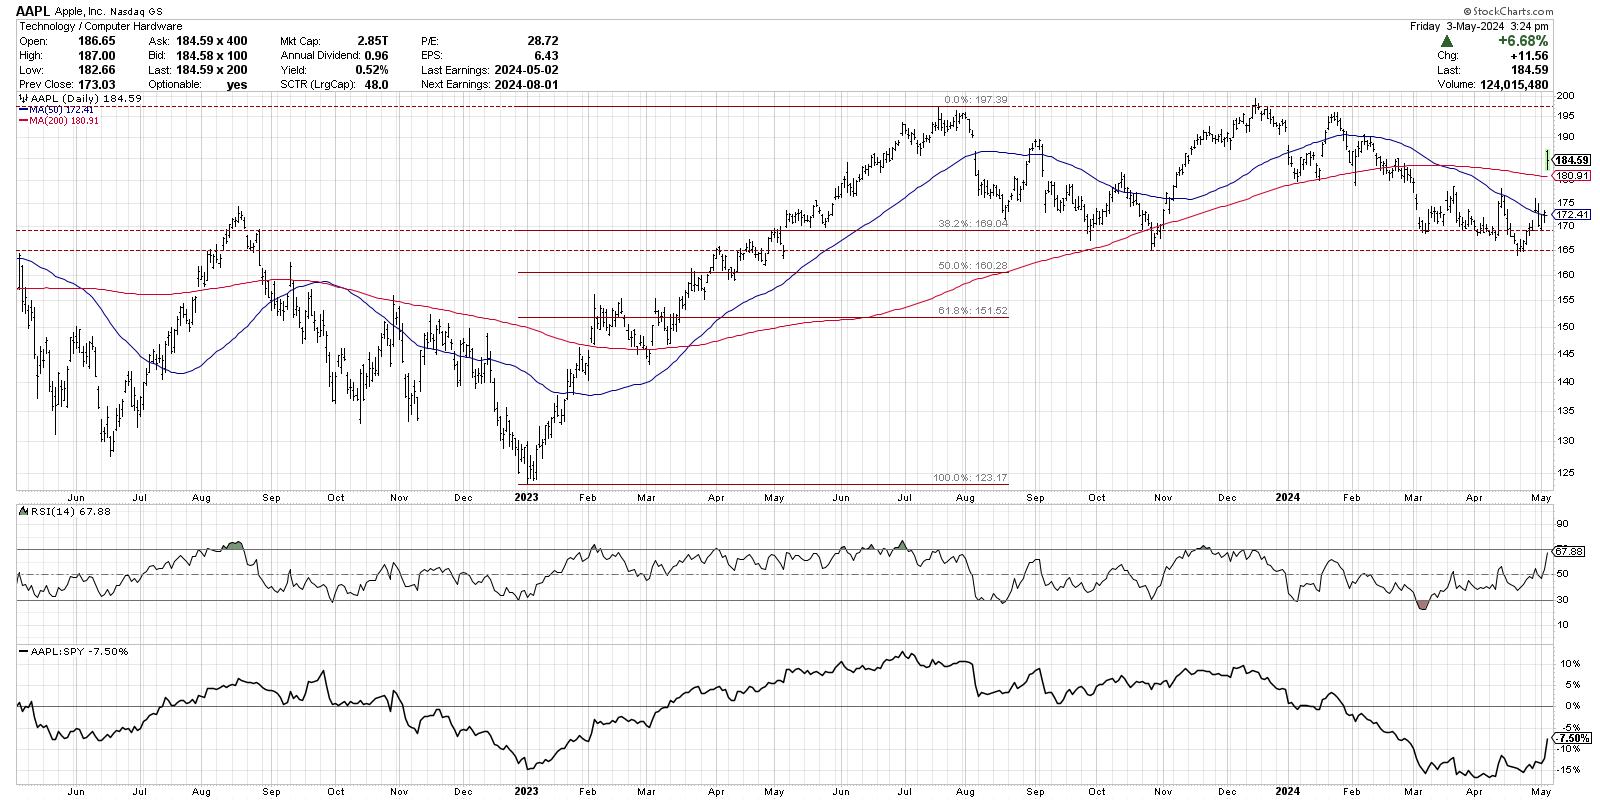
The Bull Case for Buffett's Biggest Holding
As investors flock to Omaha, Nebraska in their annual pilgrimage to learn from the great Warren Buffett, it seems an opportune time to reflect on the technical evidence for Berkshire's biggest holding, Apple (AAPL) Read More
RRG Charts2w ago
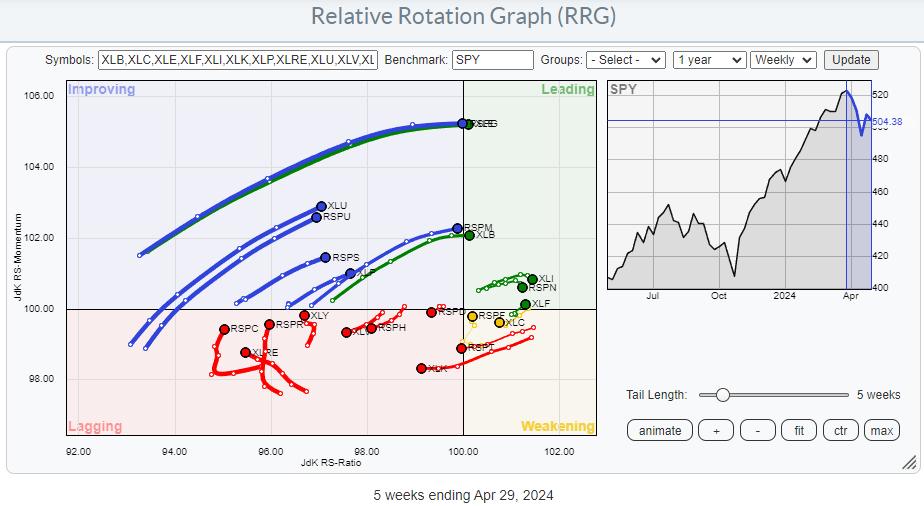
Diverging Tails on This Relative Rotation Graph Unveil Trading Opportunities
All on the Same Track or? The difference between equal-weighted sectors and cap-weighted sectors is obvious. Namely, the cap-weighted variant is much heavier and is impacted by the changes in some heavy-weight, often mega-cap, stocks Read More
The Final Bar2w ago

The BULL Case for BITCOIN
In this edition of StockCharts TV's The Final Bar, Dave welcomes Adrian Zduńczyk, CMT of The ₿irb Nest. David recaps a busy earnings week, breaking down the charts of PTON, AAPL, and more Read More
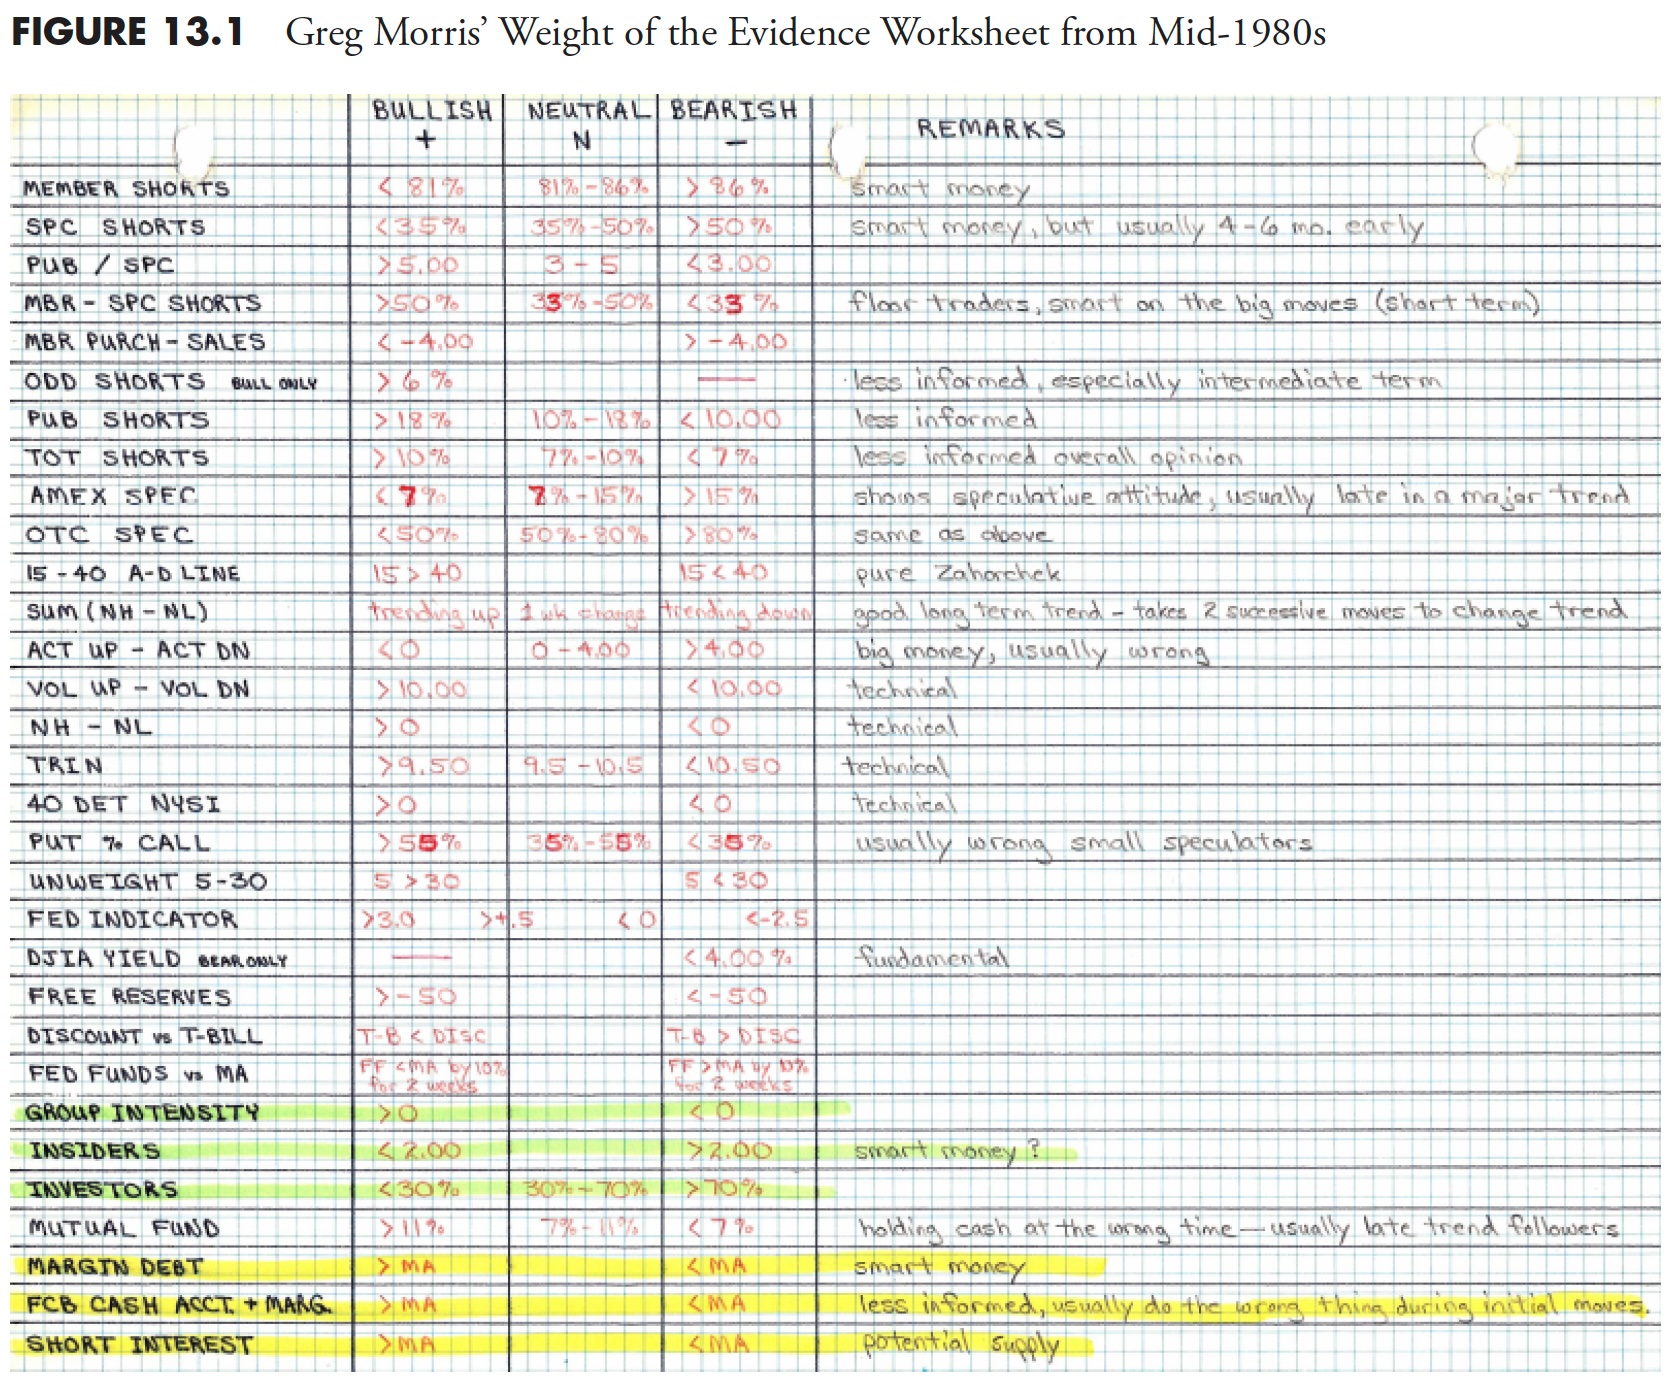
Dancing with the Trend2w ago
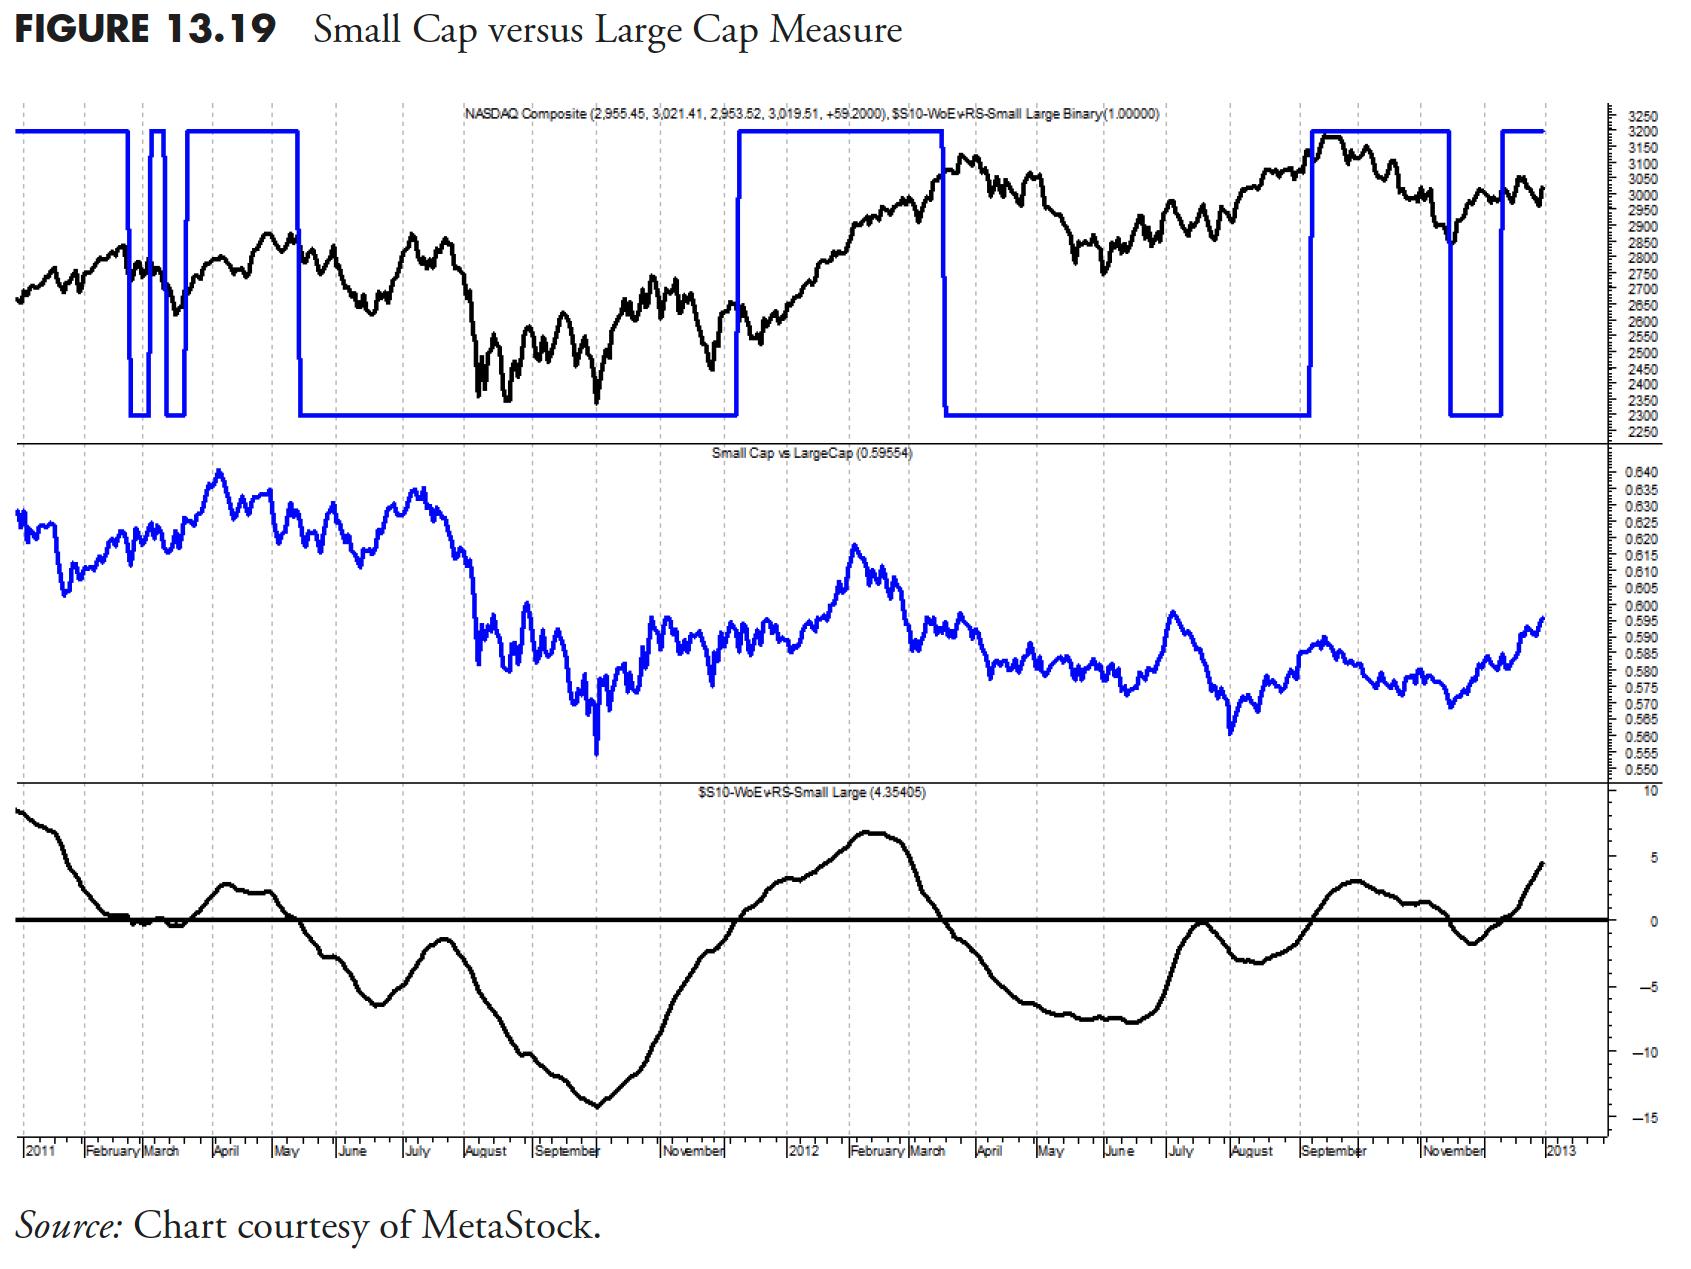
Rules-Based Money Management - Part 3: Relative Strength and Other Measures
Note to the reader: This is the nineteenth in a series of articles I'm publishing here taken from my book, "Investing with the Trend." Hopefully, you will find this content useful Read More
Don't Ignore This Chart!2w ago
AMD at a Crossroads: Buy Now or Brace for More Losses?
Advanced Micro Devices (AMD) slightly topped Wall Street's earnings and guidance expectations on Tuesday, but, instead of rallying, its stock tumbled 7%. AMD was at its 61 Read More
The Final Bar2w ago
Market Pops, Then Drops on Fed Day
In this edition of StockCharts TV's The Final Bar, Dave welcomes guest Adam Turnquist, CMT of LPL Financial. Dave debriefs on today's Fed meeting market reaction, reviewing concerning technical developments for NVDA, AMD, SMCI, NCLH, and MAR Read More
Members Only
Martin Pring's Market Roundup2w ago
Time for a Pause in the Ongoing Dollar Bull Market? Or Full Steam Ahead?
I last wrote about the dollar in December, where I came to the conclusion that a limited rally was a likely possibility in what was assumed to be a primary bull market Read More
Stock Talk with Joe Rabil2w ago
Gain AN EDGE Over Other Traders with ADX/DI
On this week's edition of Stock Talk with Joe Rabil, Joe breaks down the differences between buyers and sellers, and shows how the ADX/DI can be used in three different ways: The action phase, low ADX period and an expansion phase Read More
Members Only
Larry Williams Focus On Stocks2w ago
35 Years of Crude Oil Forecasting the Future | Focus on Stocks: May 2024
Don't Ignore This Chart!2w ago

SPY's Pullback Continues: How To Know When It's Over
What's a trader to do when the stock market looks indecisive? Sit back and wait for the market to show direction Read More
The Final Bar2w ago
Stocks Plunge with Key Earnings on Tap
In this edition of StockCharts TV's The Final Bar, Dave welcomes Gina Martin Adams, CMT CFA of Bloomberg Intelligence. David highlights a spike higher in the VIX, and charts names for earnings including AMZN, AMD, SMCI, SBUX, MCD, PYPL, and ETN Read More
The Final Bar2w ago
Key Levels for AMZN, AMD, & AAPL Earnings!
In this edition of StockCharts TV's The Final Bar, Dave recaps the S&P 500's late inning rally to test the 50-day moving average from below Read More
DecisionPoint2w ago
DP Trading Room: Intermediate-Term View of the Magnificent 7
Today Carl puts the spotlight on the Magnificent 7 with a look at not only the daily charts, but also a review of the intermediate term using weekly charts. See where they are headed short-term and what are our expectations are in the intermediate term Read More
GoNoGo Charts2w ago
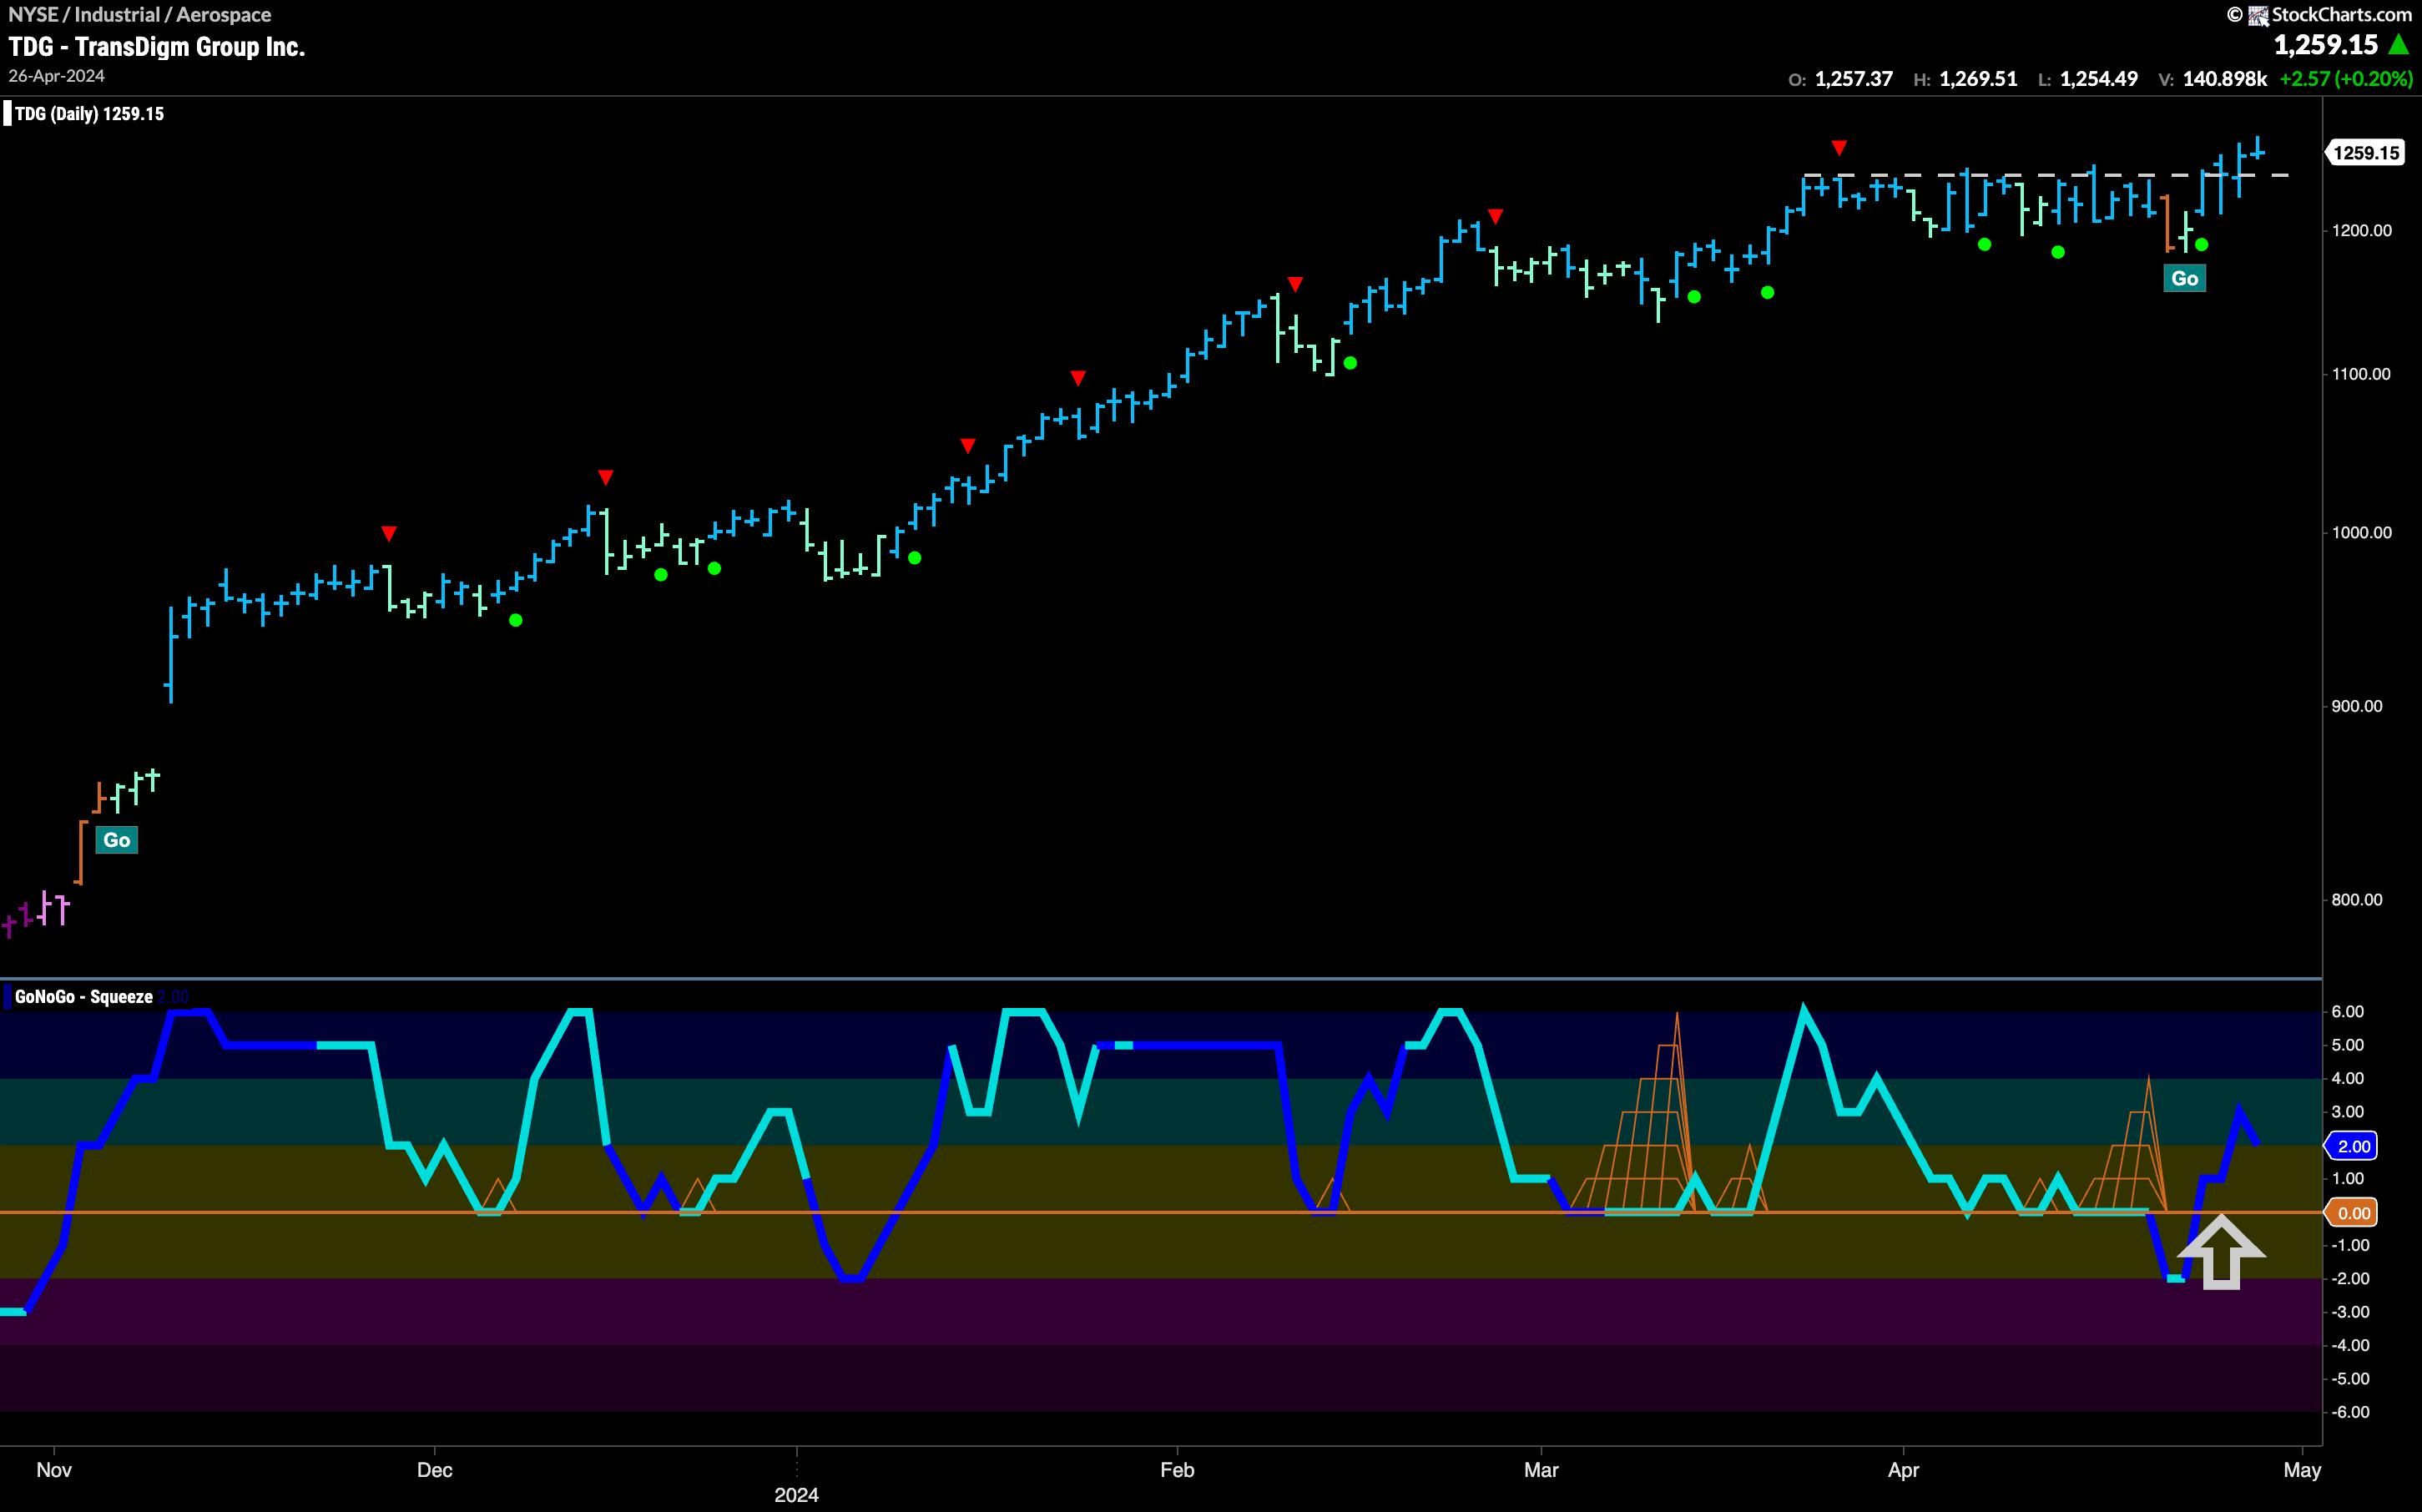
EQUITIES CLIMB OFF LOWS WITH A PUSH FROM AEROSPACE AS "NOGO" PREVAILS
Good morning and welcome to this week's Flight Path. The equity "NoGo" trend continued this week even with some relief rallies as price attempted to move higher from the recent low. We see GoNoGo Trend painting weaker "NoGo" bars as the week ended Read More
Trading Places with Tom Bowley2w ago
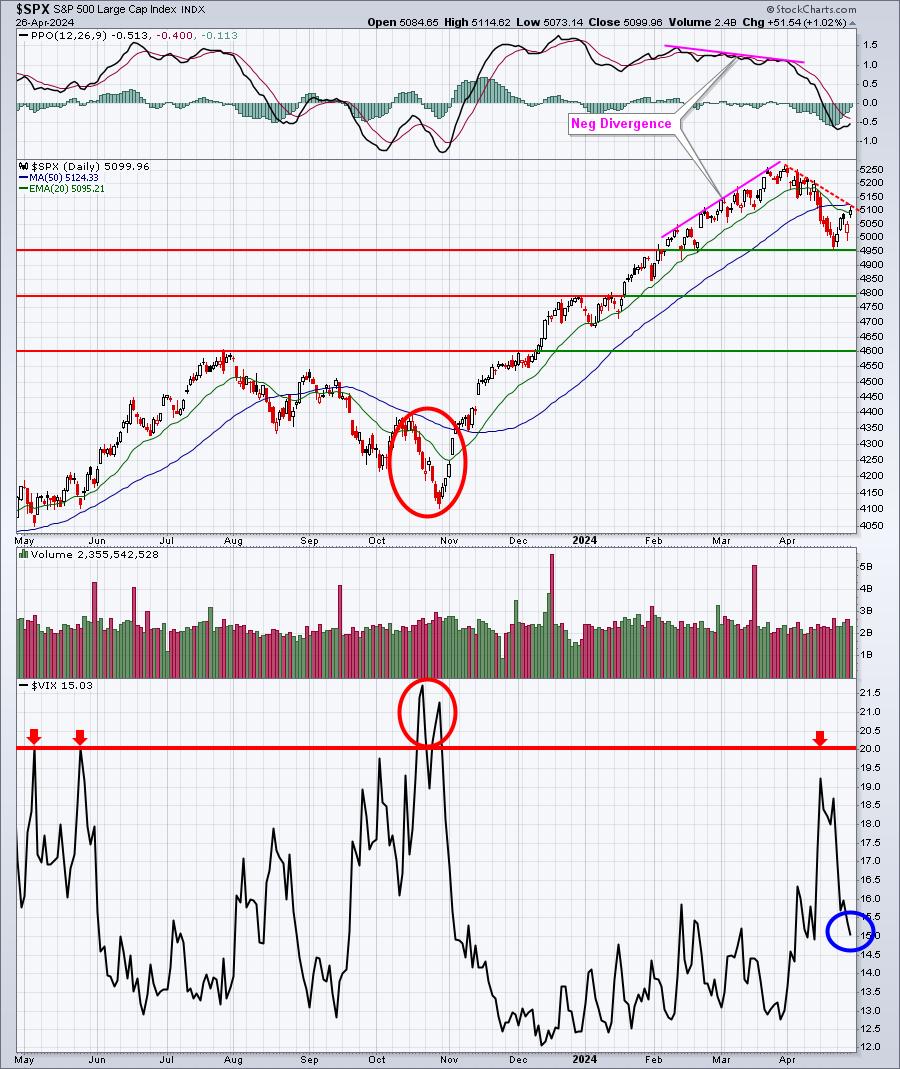
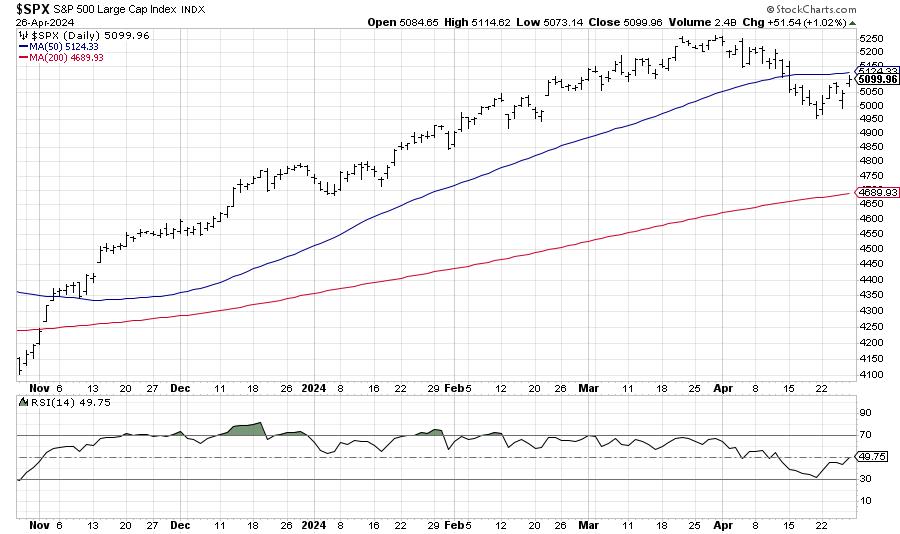
Here's What You Need To Know About Last Week's Rebound
The Volatility Index ($VIX) is one of my key sentiment indicators and it has a history of accurately predicting corrections and bear markets. We've had neither without the VIX first clearing an important hurdle in the 17-20 range Read More
Analyzing India3w ago
Week Ahead: Upsides For NIFTY May Stay Capped; Sectoral Landscape Show These Changes
Over the past trading week, it was expected that, while technical pullbacks in the markets could get extended, NIFTY would likely remain under corrective pressure at higher levels. The past trading days witnessed this precise scenario Read More
The Mindful Investor3w ago
S&P 500 Makes a New All-Time High By End of June?
We've been covering the signs of weakness for stocks, from the bearish divergences in March, to the mega-cap growth stocks breaking through their 50-day moving averages, to even the dramatic increase in volatility often associated with major market tops Read More
GoNoGo Charts3w ago
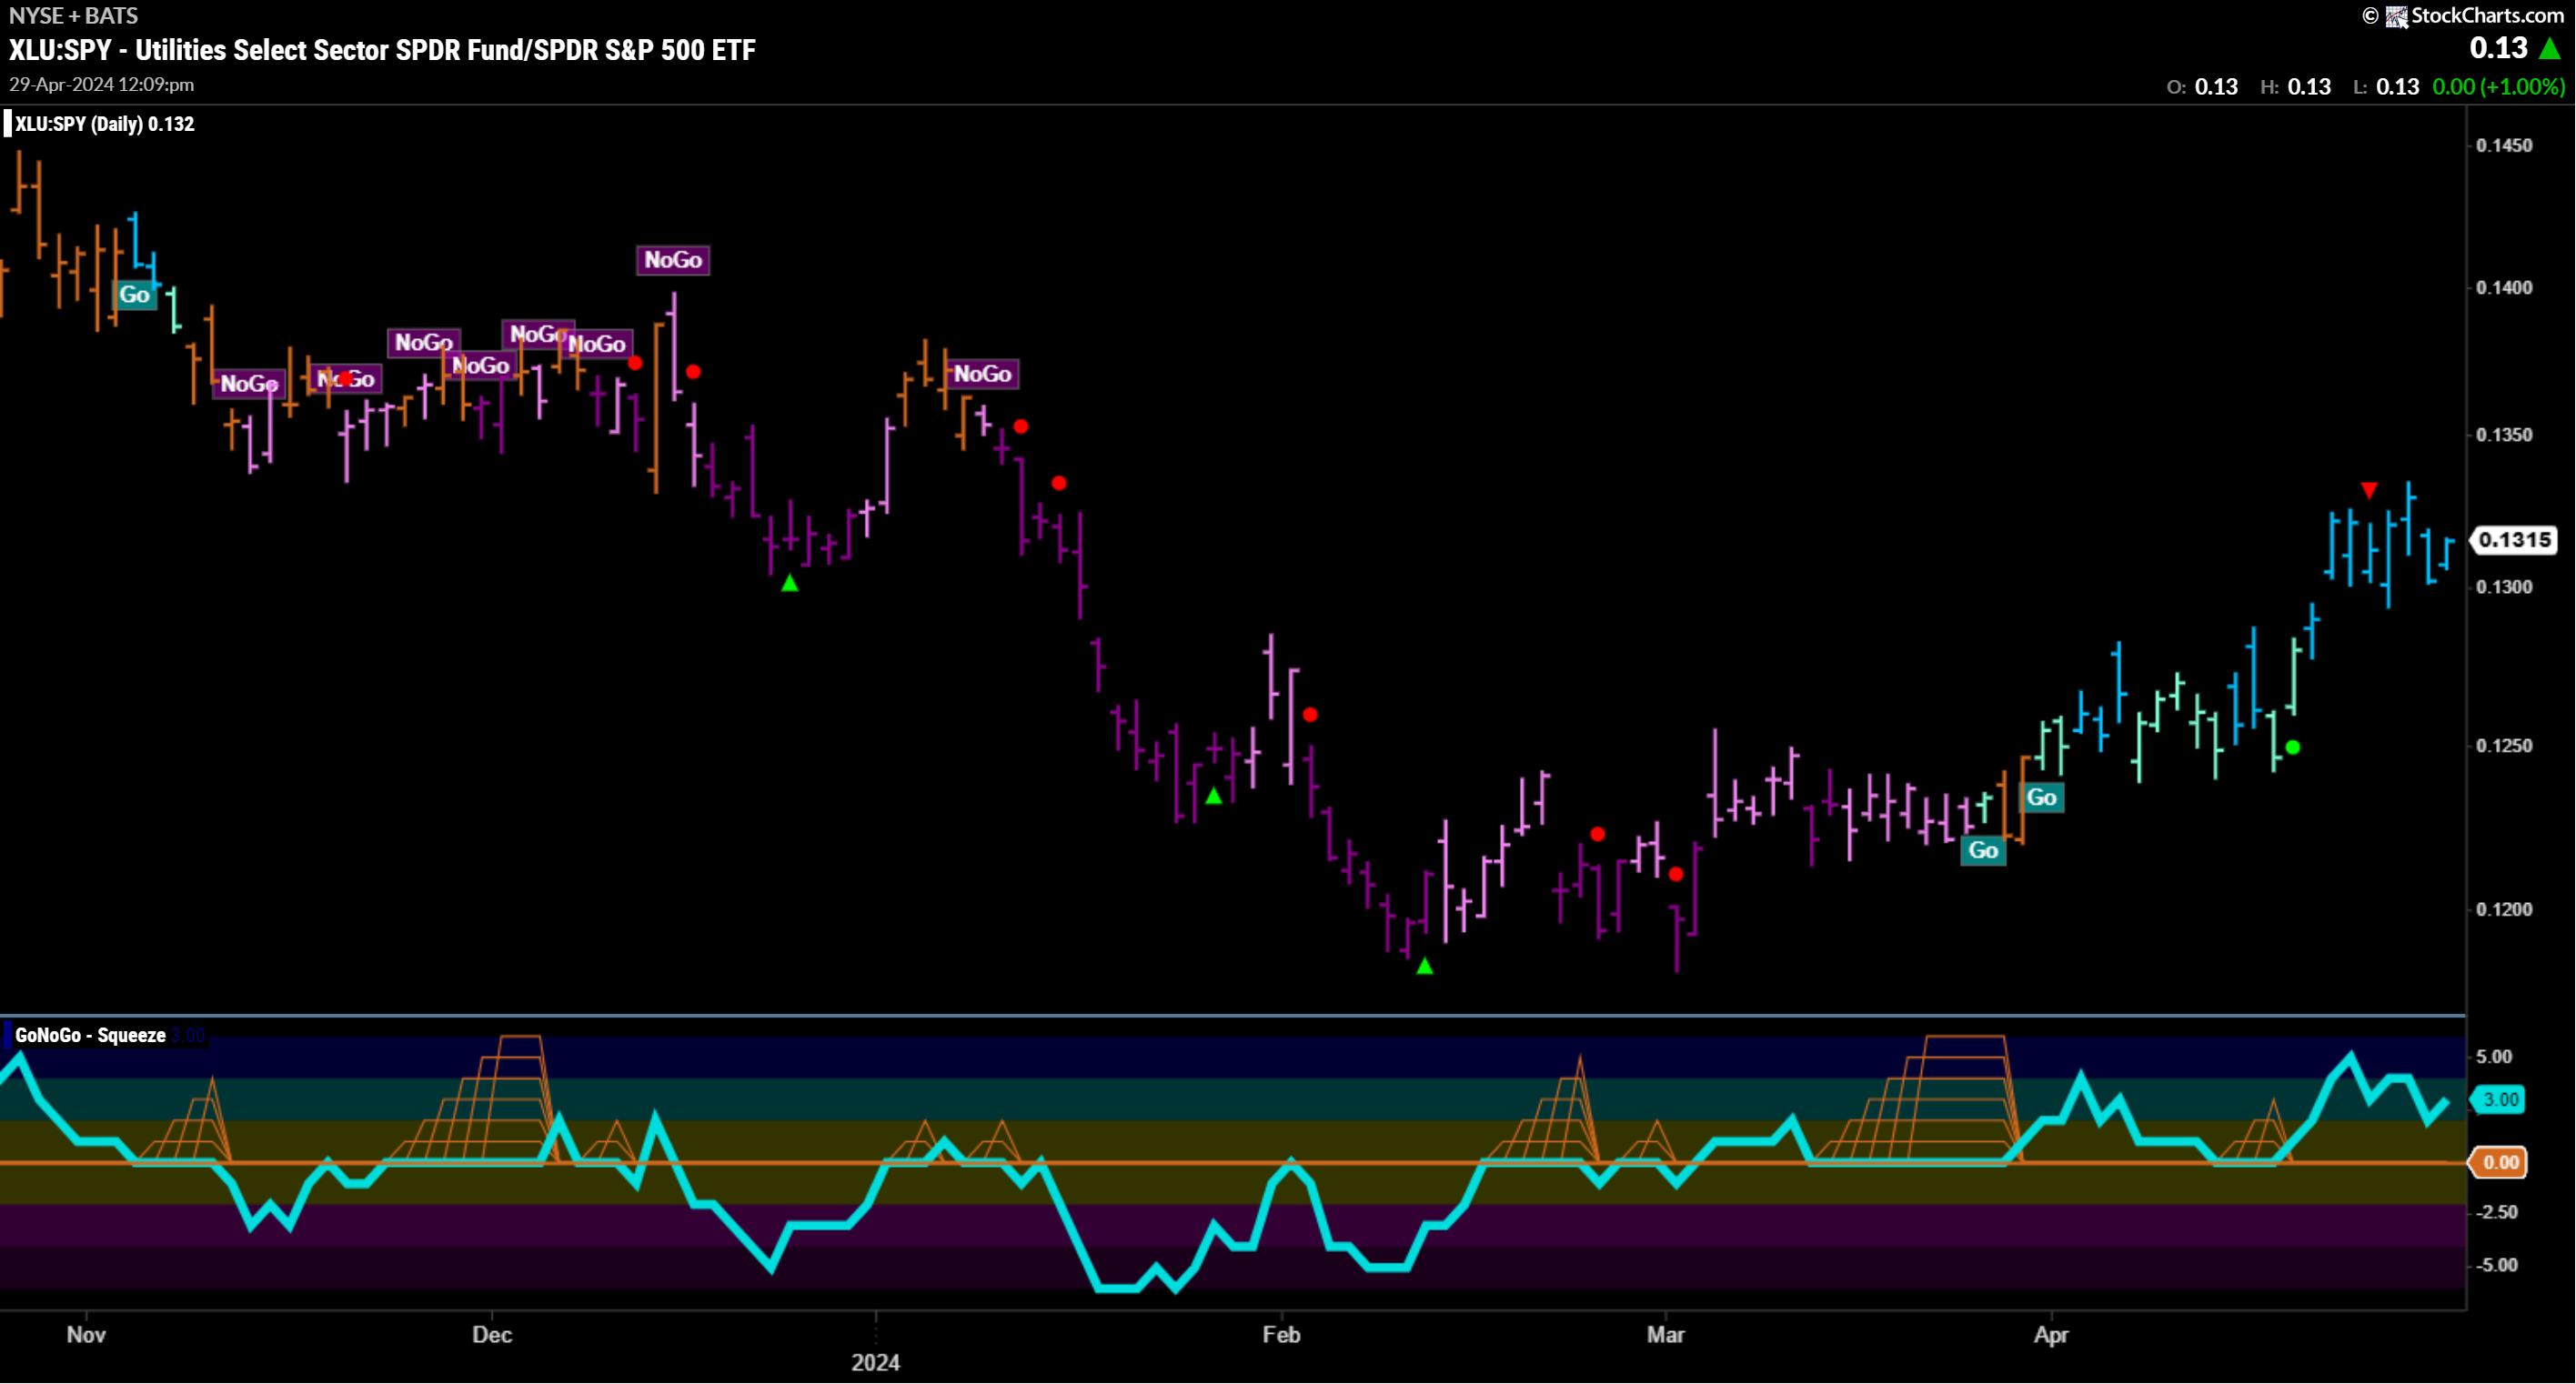
DEFENSE IS ON THE FIELD | GoNoGo Show APRIL 26, 2024
Chart Above (XLU:SPY) highlights trending relative strength of Utilities Sector. Watch Video below for details: The S&P500 trend conditions have continued this week in "NoGo" conditions despite relief rallies Read More
The MEM Edge3w ago
MEM TV: Wait For This Before Getting Back In
In this episode of StockCharts TV's The MEM Edge, Mary Ellen reviews the key drivers for this week's volatile period, including Core PCE and GDP numbers. She takes a look at where the S&P 500 and NASDAQ closed for the week and whether it's safe to put new money to work Read More
The Final Bar3w ago
Spotting Downturns Early: Daily or Weekly Charts?
In this edition of StockCharts TV's The Final Bar, Dave answers viewer questions on spotting downturns in daily vs. weekly charts, using the Relative Rotation Graphs (RRG) to identify actionable ideas, and comparing the NYSE Composite Index ($NYA) to the S&P 500 Index ($SPX) Read More
ChartWatchers3w ago

S&P 500 & Nasdaq Composite Approach Critical Resistance; Watch for These Important Levels!
A tug-of-war with no clear winner—that's what the stock market seemed to be playing this week. With a Fed meeting, key economic data, and more earnings on top, will a winner emerge next week? It was an interesting week in the stock market Read More
Don't Ignore This Chart!3w ago

Analyzing Alphabet's Surge — Here's How to Get In Earlier Next Time
Using technical indicators to identify stocks fundamentally undervalued but technically strengthening is a common practice Read More
DecisionPoint3w ago
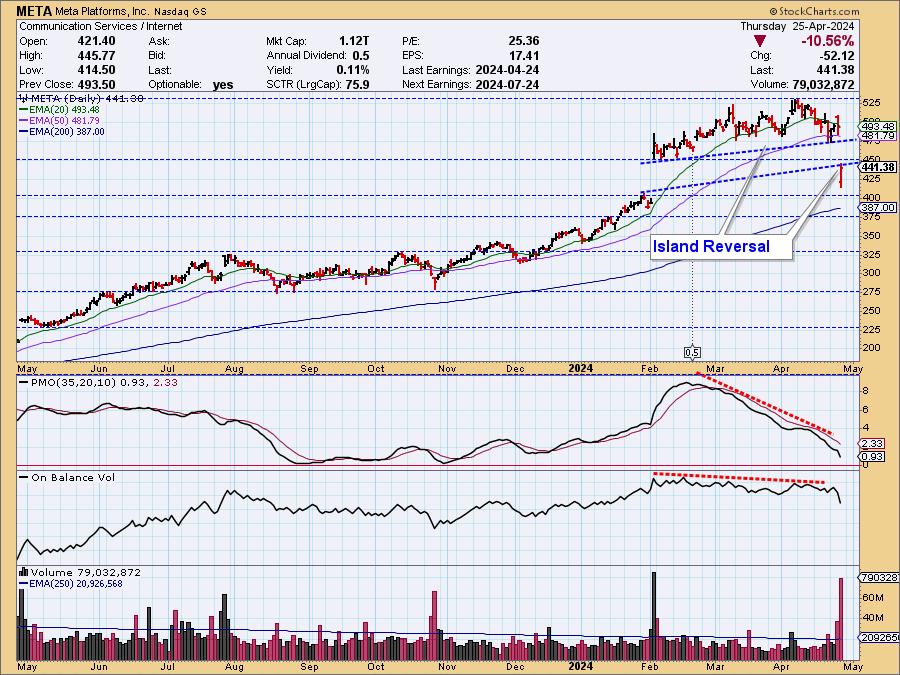
META's Reverse Island - Two More Mag Seven Islands to Monitor
Whenever we see price gapping up or down, as happened with META in February, we prepare for the possibility of an island reversal. After the gap up, price forms a cluster, the island, and we ponder the possibility of a gap down to complete the reversal Read More
Don't Ignore This Chart!3w ago

Analyzing the SPY: How to Know When the Pullback is Over
Last week, investors were spooked by geopolitical tensions and expectations of interest rates remaining higher for longer. The fear sent investors selling equities, resulting in the broader indexes breaking below their upward trendlines Read More
Dancing with the Trend3w ago
Rules-Based Money Management - Part 2: Measuring the Market
Note to the reader: This is the eighteenth in a series of articles I'm publishing here taken from my book, "Investing with the Trend." Hopefully, you will find this content useful Read More
RRG Charts3w ago
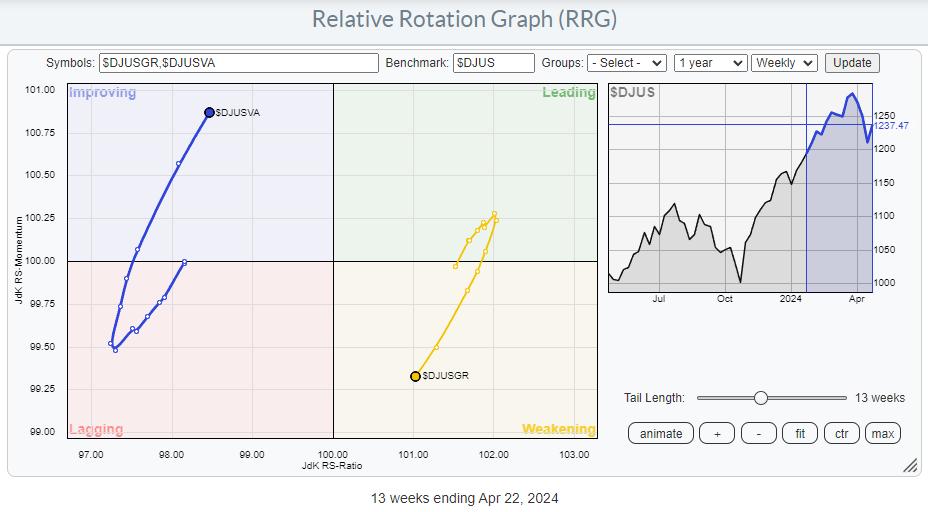
10% Downside Risk For Stocks as Value Takes The Lead
Value Taking the Lead from Growth The weekly RRG above shows the rotation for Growth vs. Value stocks, with the DJ US index as the benchmark. The recent rotation clearly shows the rotation out of growth into value taking shape and picking up steam Read More
Popular Articles

The One Chart to Watch as S&P 500 Makes New All-Time Highs

Is This the Magic Upward Break Everybody Was Waiting For?

Gold Is Doing Great!

Major Shifts Taking Place As Lower Rate Bets Increase

Bitcoin Sets Up with Classic Continuation Signal

Gold and Silver Set to Smash Records: Could 2024 Be Their Biggest Year Yet?
Get expert technical commentary delivered straight to your inbox! Sign up for our FREE weekly ChartWatchers Newsletter. Learn More
Featured Authors


Featuring a diverse collection of books, DVDs and more, The StockCharts Store has everything you need to learn more about financial charting, improve your trading systems and become a better investor.
Public ChartList Leaders


StockCharts Members unlock complete access to the Stocks & Commodities Magazine archives. Read the latest articles or browse past editions.