Note to the reader: This is the twenty-first in a series of articles I'm publishing here taken from my book, "Investing with the Trend." Hopefully, you will find this content useful. Market myths are generally perpetuated by repetition, misleading symbolic connections, and the complete ignorance of facts. The world of finance is full of such tendencies, and here, you'll see some examples. Please keep in mind that not all of these examples are totally misleading -- they are sometimes valid -- but have too many holes in them to be worthwhile as investment concepts. And not all are directly related to investing and finance. Enjoy! - Greg
Pullback Rally Analysis
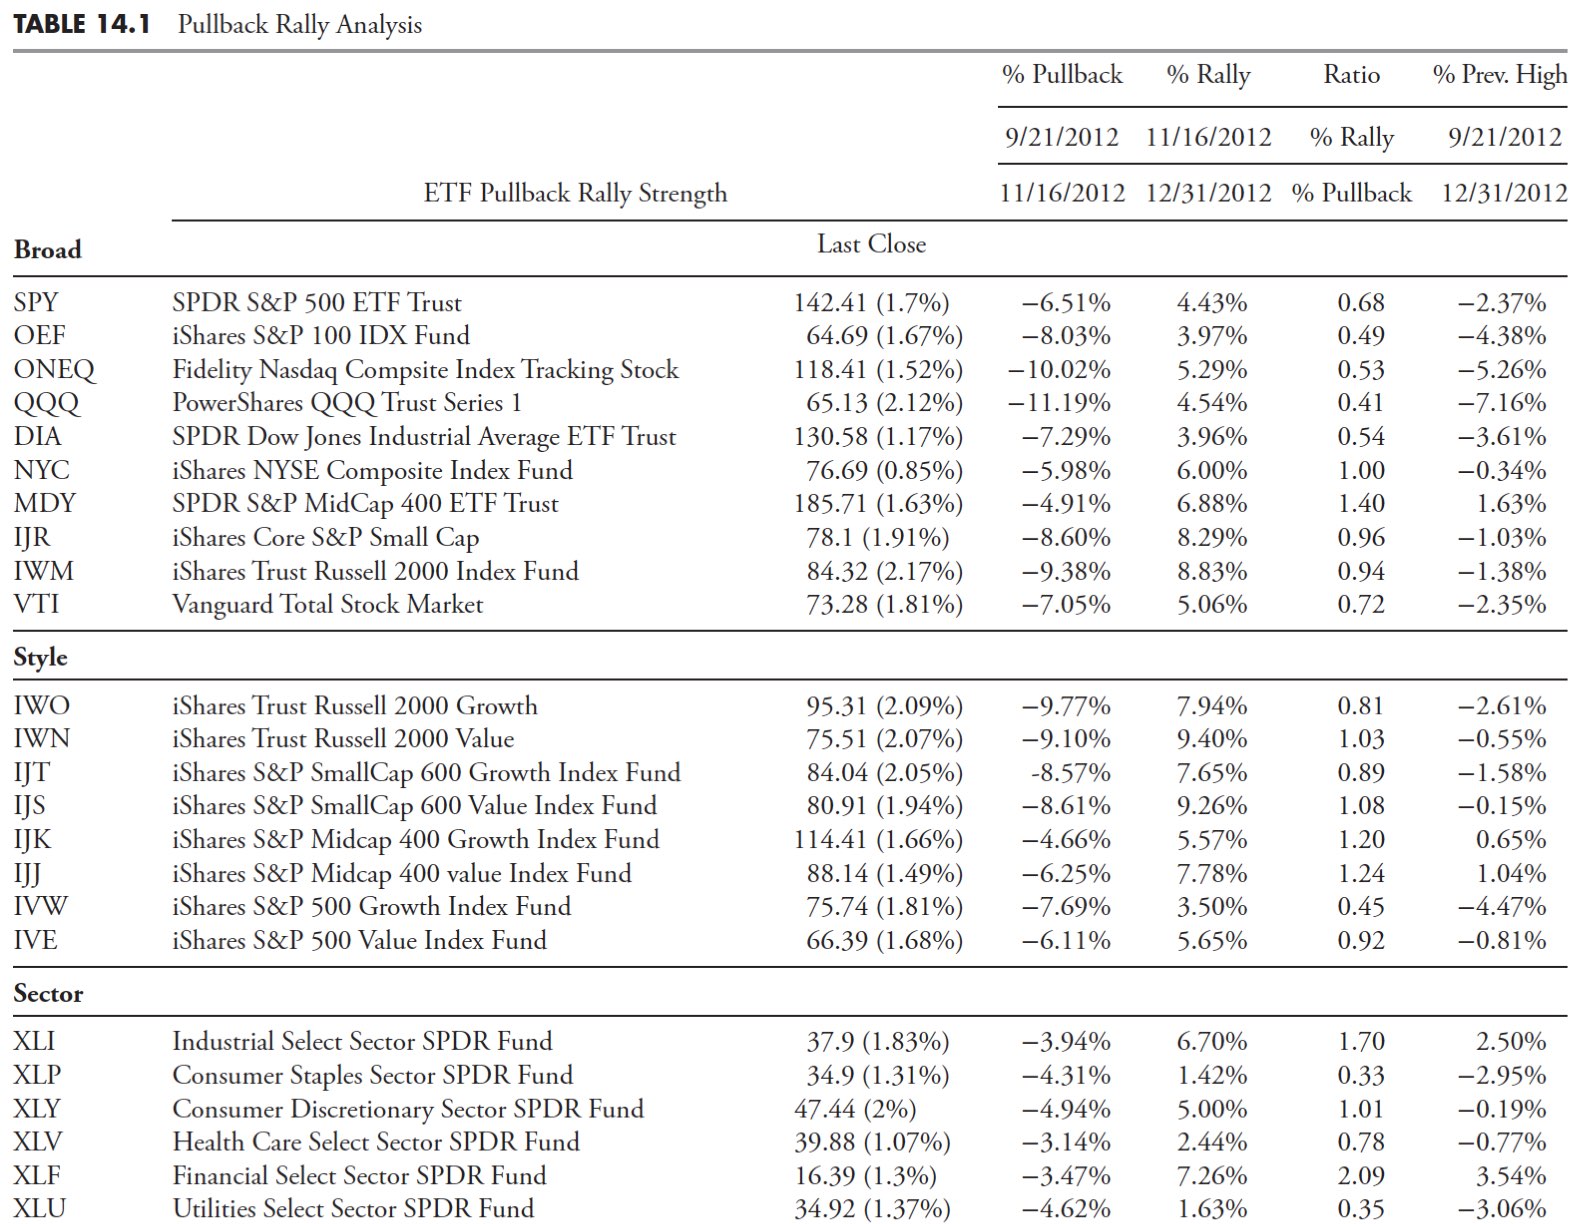
The Pullback Rally Analysis is not a ranking measure, but a technique for determining the relative strength of issues by looking at the most recent rally from a previous pullback. To summarize, in pullback rally analysis, you measure the amount of the pullback in percent, then measure the current rally up to the current date in percent. The concept is fairly simple; those issues that dropped the least in the pullback, will probably outperform in the following rally.
This concept measures the percentage move during the pullback, the percentage to date of the current rally, and the percentage to date from the beginning of the pullback. This is a great method to see strength outside of the snapshot of the ranking measures. Figure 14.23 shows an example on how to determine the dates for the beginning and end of the pullback. From the chart, you can see a peak at point A with a pullback down to point B. The rally is then measured from point B to the current date.

A ratio of the percentage move of the current rally to the percentage move of the previous pullback is calculated. Another calculation is percentage the current price is from the beginning of the pullback (previous high). This data, when ranked, will help you determine strength in the rally as compared to the previous pullback. Often the stronger issues in a pullback are the leaders during the rally.
Table 14.1 shows the data for the Pullback Rally Analysis. You can see from even a quick glance at Table 14.1 that the international ETFs are outperforming, not only in the rally phase (% Rally), but also how almost all are now above where the previous high (beginning of pullback) began (% Prev. High). The iShares FTSE China 25 Index Fund also performed well during the pullback phase, with the only international ETF displaying a gain for that period of 2.95%, while the others were losses. The Ratio column shows the ratio of the percent of rally compared to the percent of pullback. The pullback is completed, so only the extent of the rally is unknown.
This ratio will show ETFs that performed in a couple of ways. One is that, if the ETF did not decline much during the pullback and rises quickly in the rally, it will have a large ratio. For example, in the Broad category, the SPDR S&P MidCap 400 ETF Trust (MDY) has a ratio of 1.40, highest in that category. This is because it was the best performer (least decline) in the pullback phase and ranked third in performance in the rally phase. This would indicate that MDY is a strong performer and a candidate to consider for buying. The last column, % Previous High, will also show you which ETFs are making new highs from the beginning of the pullback. This method of selection shows which issues are strong on a relative basis. In fact, it will also tell you which sectors and styles are strongest if you use ETFs that are tied to those strategies.
Pair Analysis
I remember following Martin Zweig years ago, and in fact used one of the techniques he described in his book, Winning on Wall Street, in the mid-1980s. In it, he described a really simple technique using his unweighted index (ZUPI) and on a weekly basis trading it whenever it moved 4% or more. If it moved up 4% in a week, he bought; if it moved down 4% in one week, he sold. Positions were held until the next opposing signal—just that simple. The problem I had back then was not only not following it, but trying to tweak it into something better. Eventually experience told me that he had already been down that road and I was the beneficiary of the results.
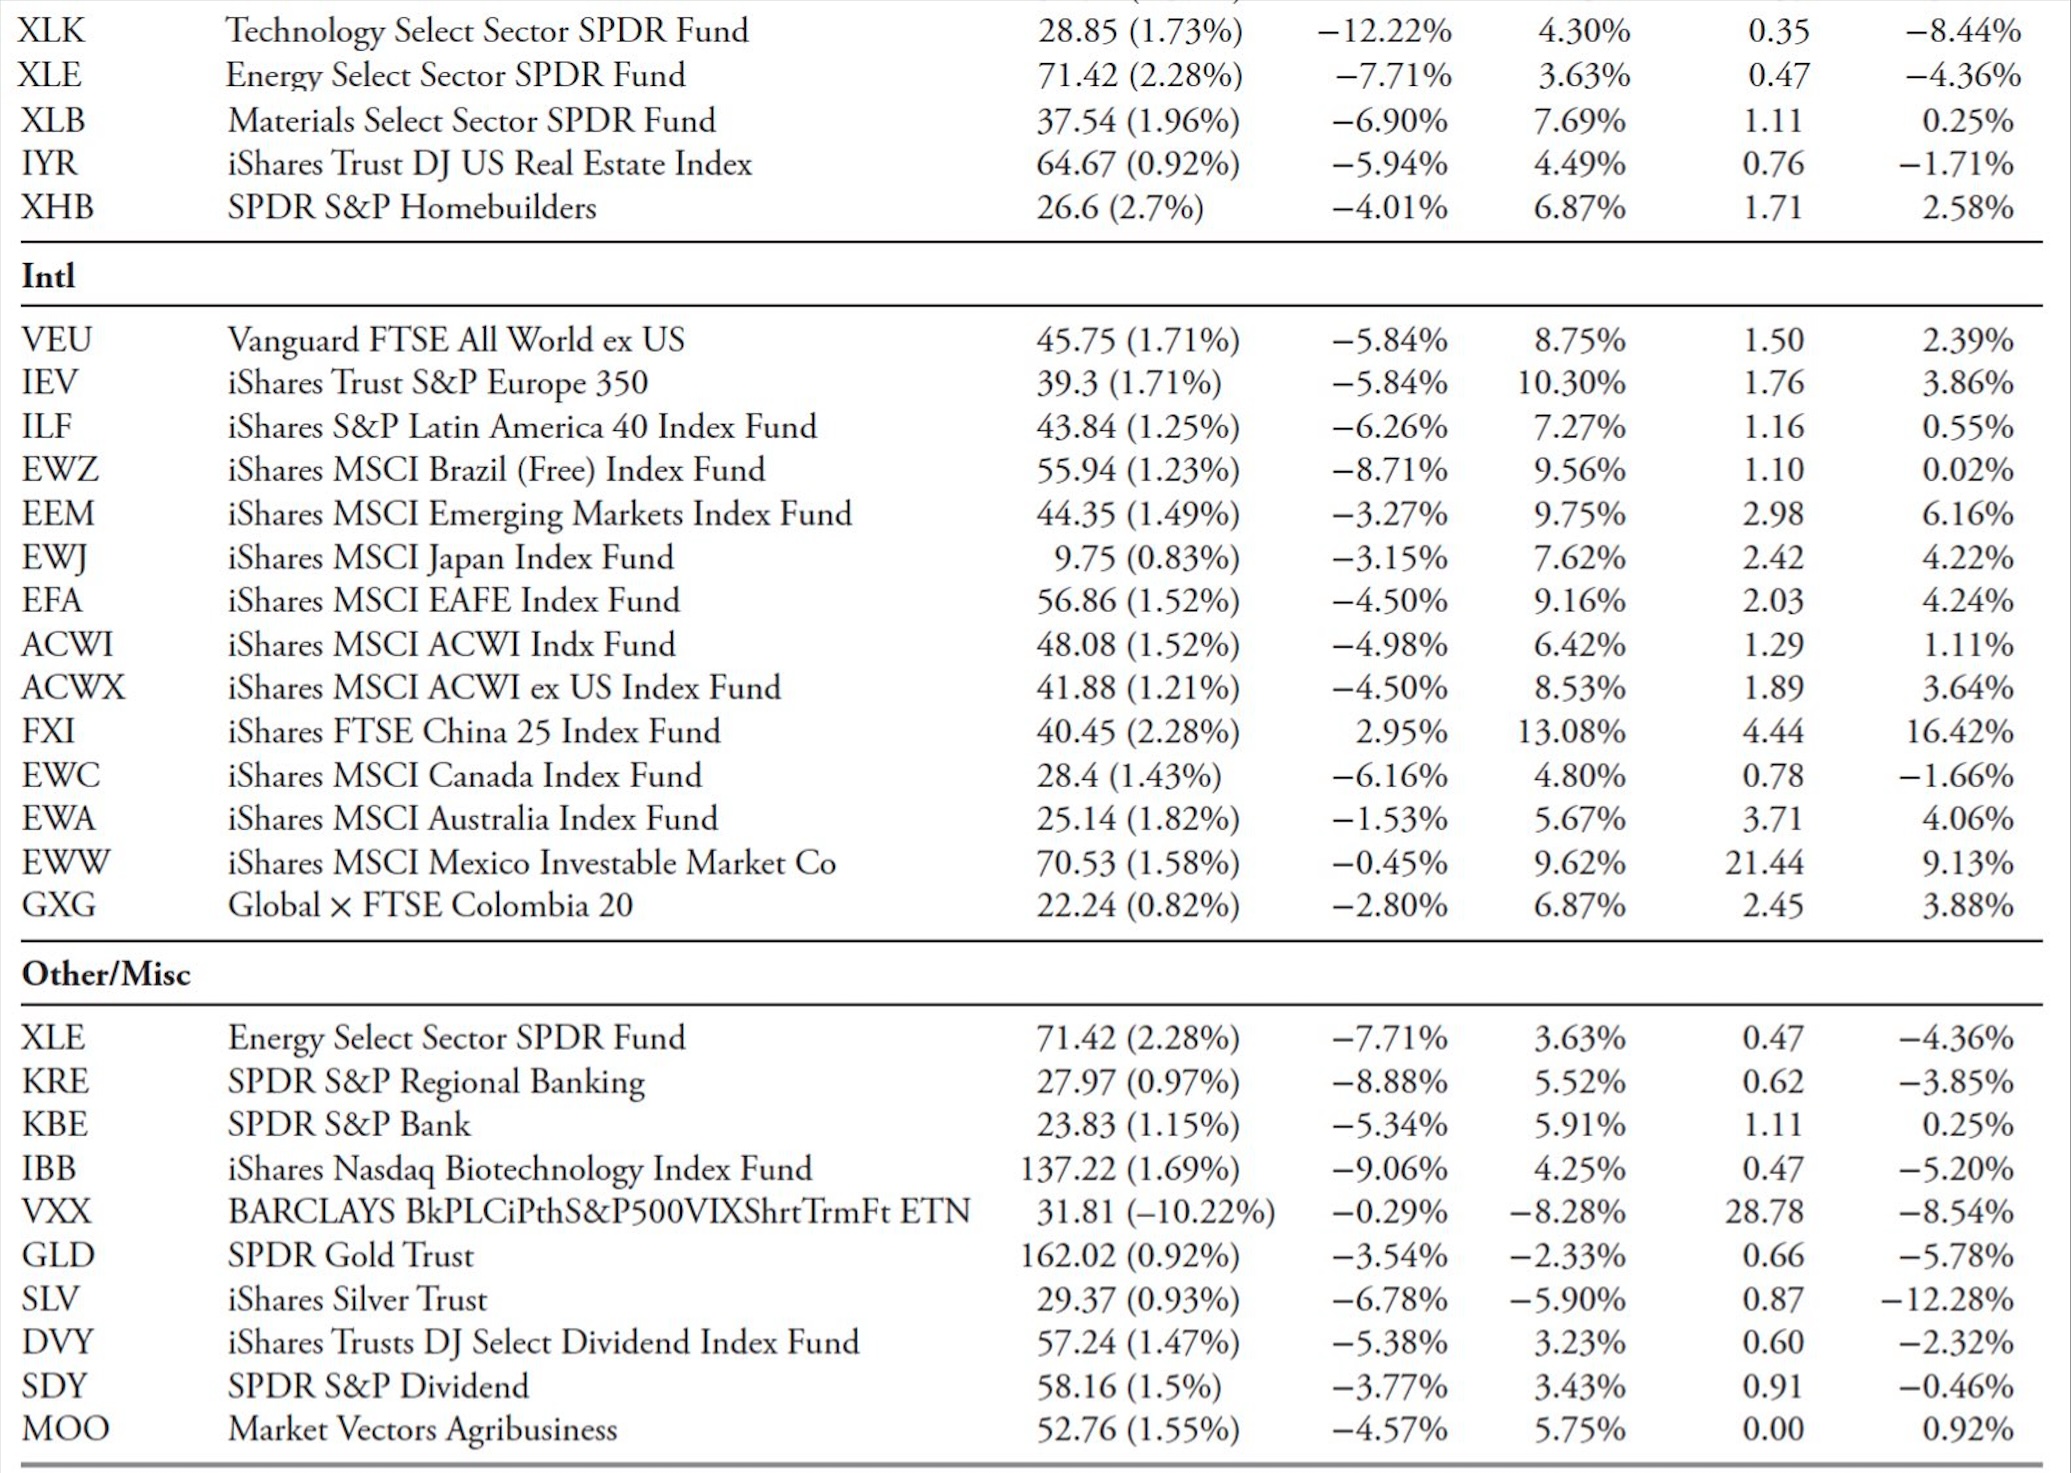
Anyway, I took this concept and used it on Index/ETF pairs, actually calculating the ratio of Index/ETF pairs and using the weekly movement of 4% to swap between the numerator and the denominator. It really works well with asset classes that are not correlated, such as equity vs. fixed income or equity vs. gold, and so on. Figure 14.24 shows an example of this pair strategy the S&P 600 small cap index (IJR) vs. the BarCap 7-10 Year Treasury index (IEF). The ratio line is the typical price line, with the binary signal line overlaid while the lower plot is the percent up and down moves for each weekly data point. Remember, this is a weekly chart. Whenever the ratio line moves by 4% in a week, as shown by the lower plot moving above or below the horizontal lines shown as +4% and -4%, the binary line overlaid on the price ratio changes direction. Repeated moves in the same direction are ignored.
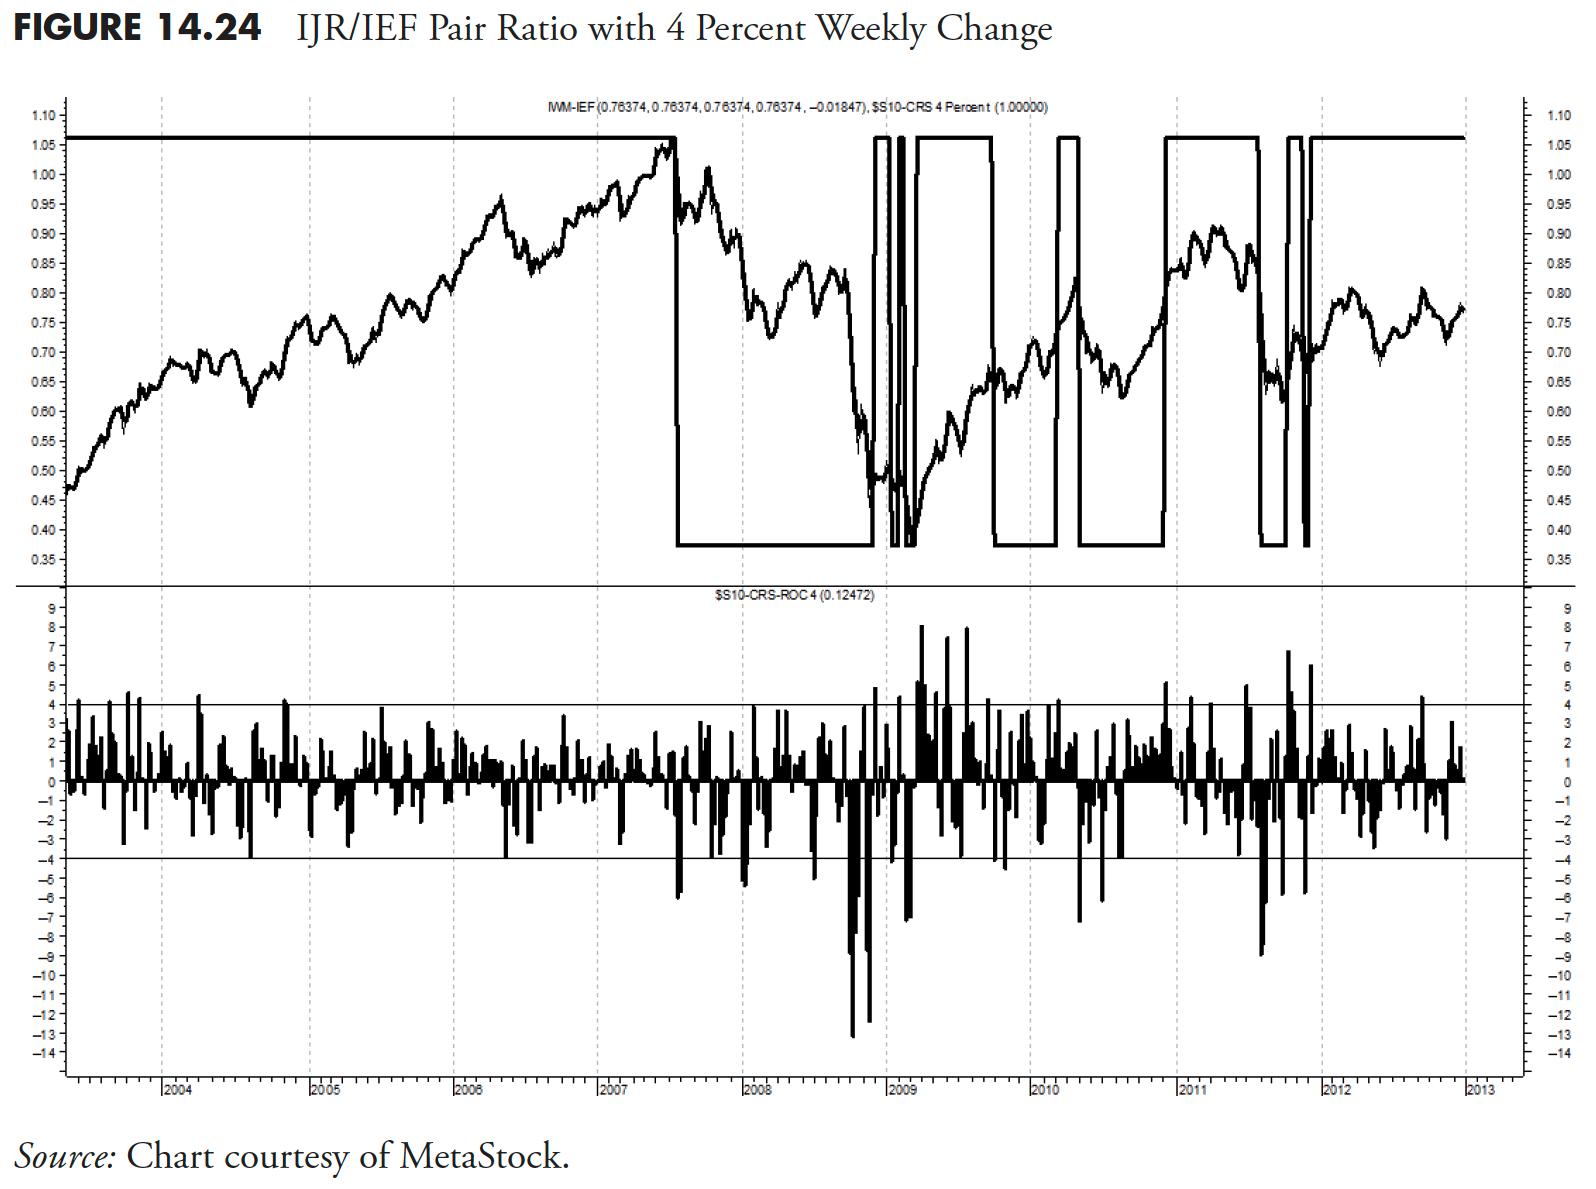
The ratio significantly outperformed each of the individual components (IJR and IEF) and the S&P 500. Figure 14.25 shows the performance of the ratio (with the numerator and denominator swapped whenever there was a move of 4% or greater), the performance of the individual components that make up the ratio, and the S&P 500.
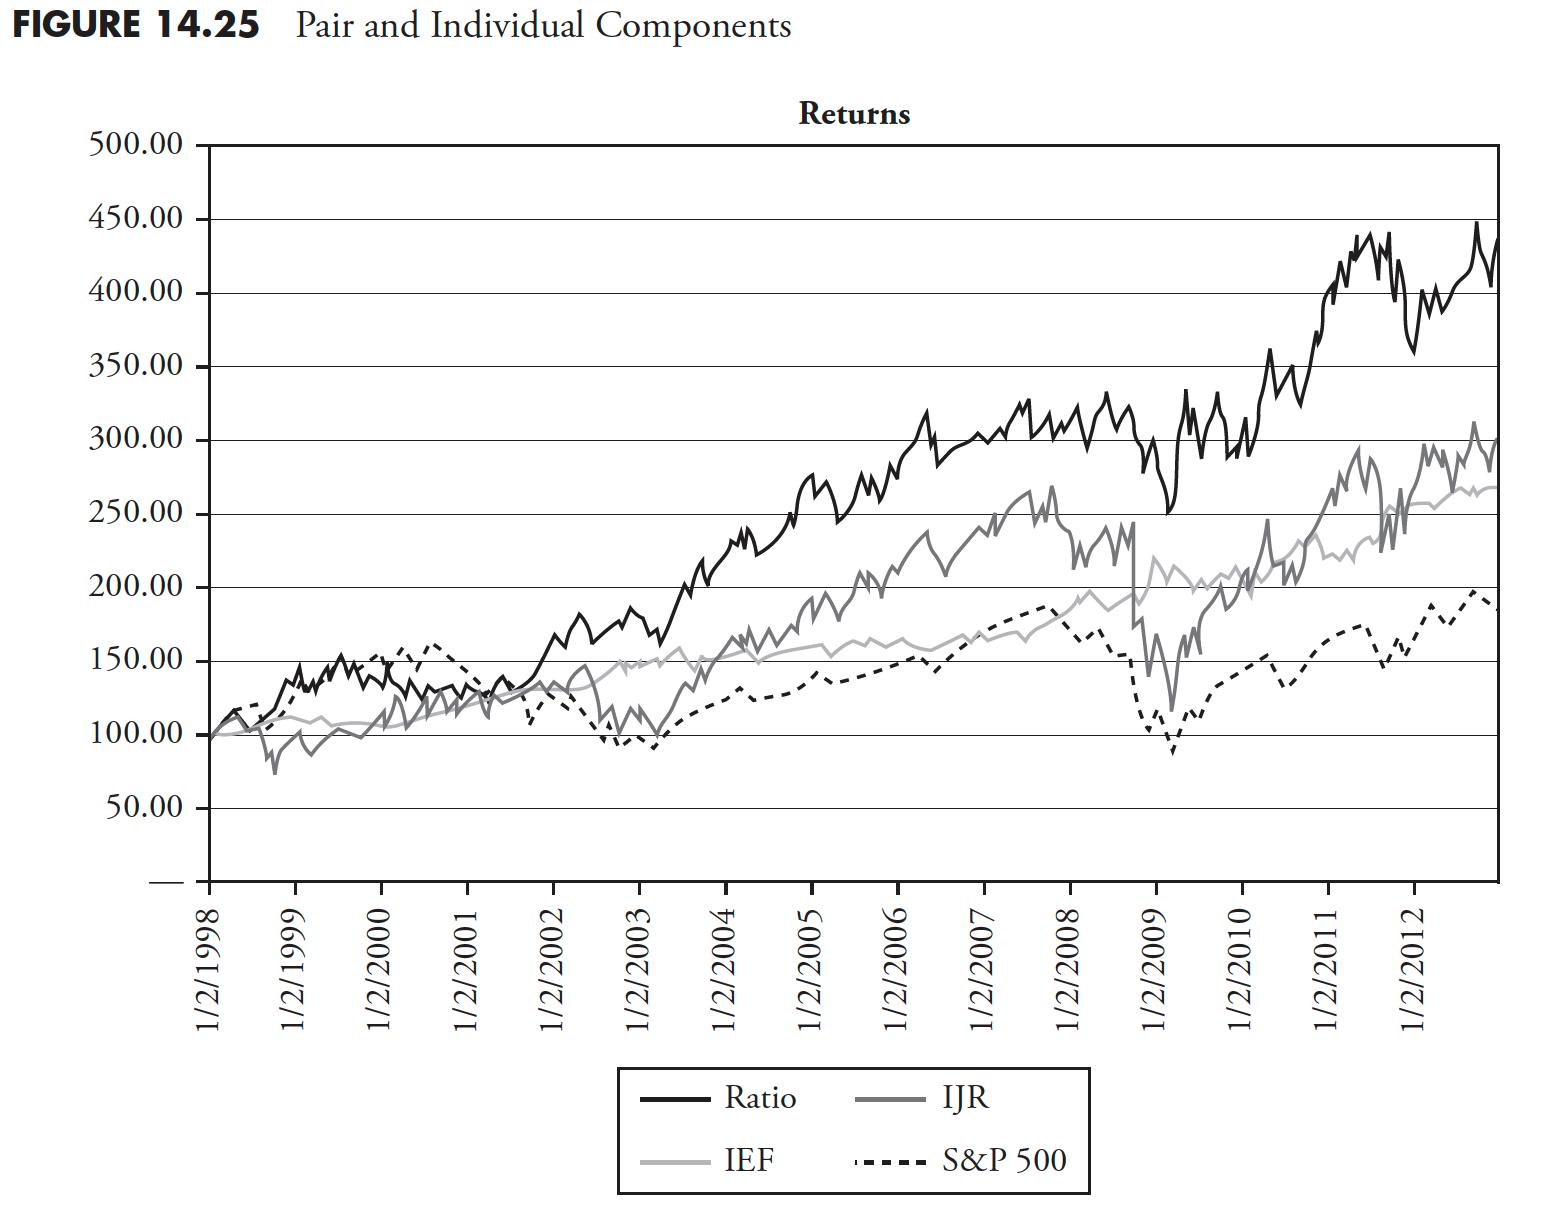
Table 14.2 shows the annualized performance statistics from 01/02/1998 until 12/28/2012 (weekly data). The Sharpe Ratio is slightly modified, in that the return is used as the numerator without a reduction for risk-free return. The Ratio rotation strategy outperformed in annualized return, and, when compared to the equity component, it reduced the Drawdown (DD) considerably, improved the Sharpe Ratio, and lowered the Ulcer Index.
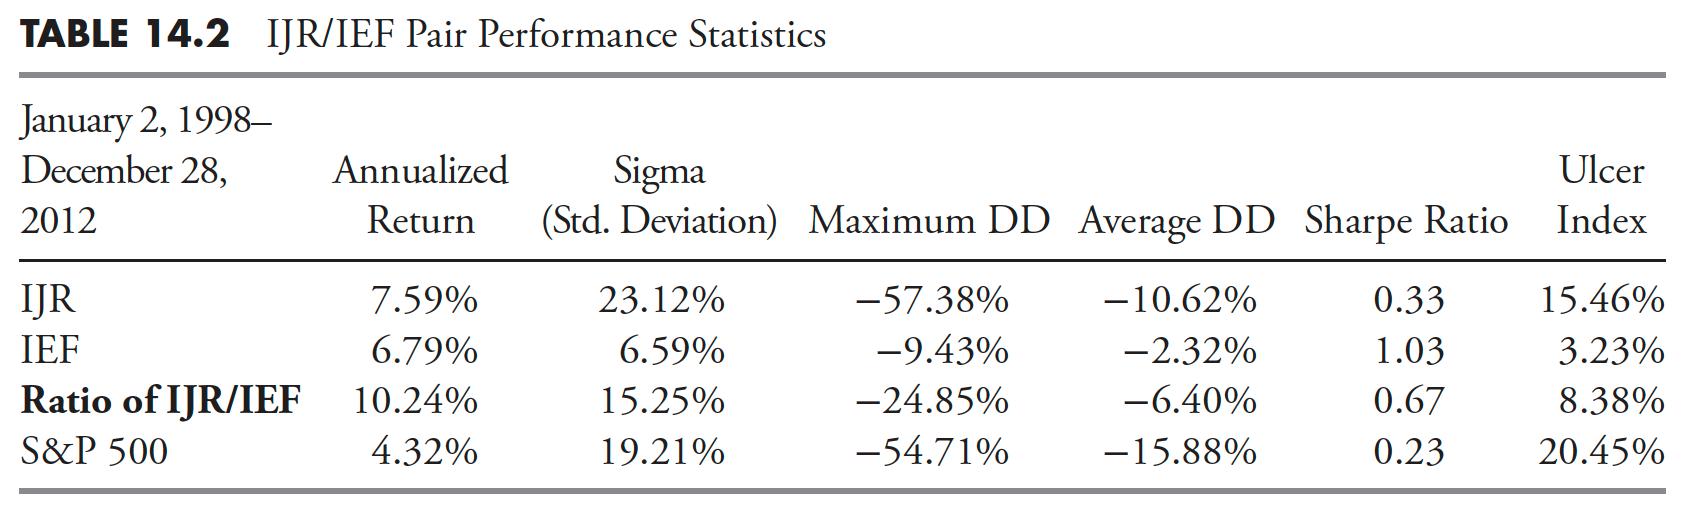
I also found that smoothing the ratio with just a two-period moving average greatly enhanced the performance because it reduced the number of trades. Trying different percentages other than Zweig's 4% worked well occasionally, but, overall, the 4% on weekly data yielded the most robust results time and time again.
The real advantage for a pair rotation strategy is when it is used as a core holding situation. In other words, if a strategy required a core holding percentage but that core could be actively managed, this would give an actively managed core holding that would have much lower drawdowns than a buy-and-hold core, and with considerably better returns. Table 14.3 shows the pairs used with an equal allocation of 25% each given to the four pairs. This adds up to an allocation of 100%, but, in this example, it means 100% of the core and the core percentage of total allocation is determined by the strategy, often 50%.
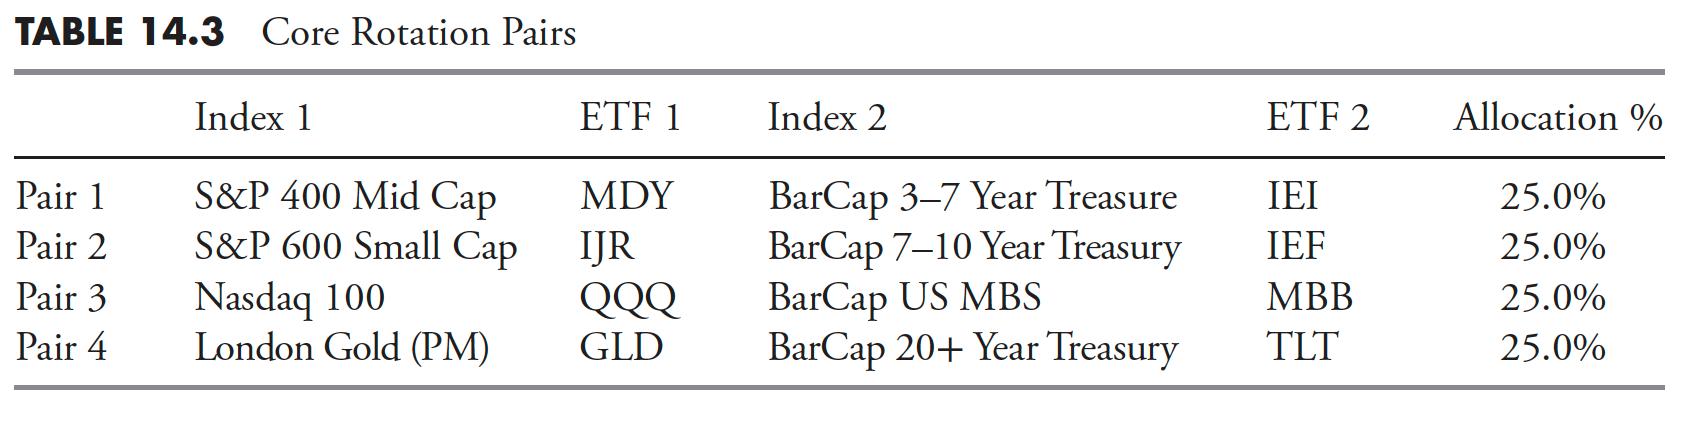 Figure 14.26 shows the results using the four different pairs in a core rotation strategy compared to buy-and-hold of the S&P 500. The drawdown in 2008 was limited to only 14%, and other than that was a nice ride. The average drawdown (see Table 14.4) is only 20% of the maximum drawdown. I was curious about the lack of performance in 2012 and found it was the fact that in the Gold/20-Year Treasury pair gold was the holding the entire period.
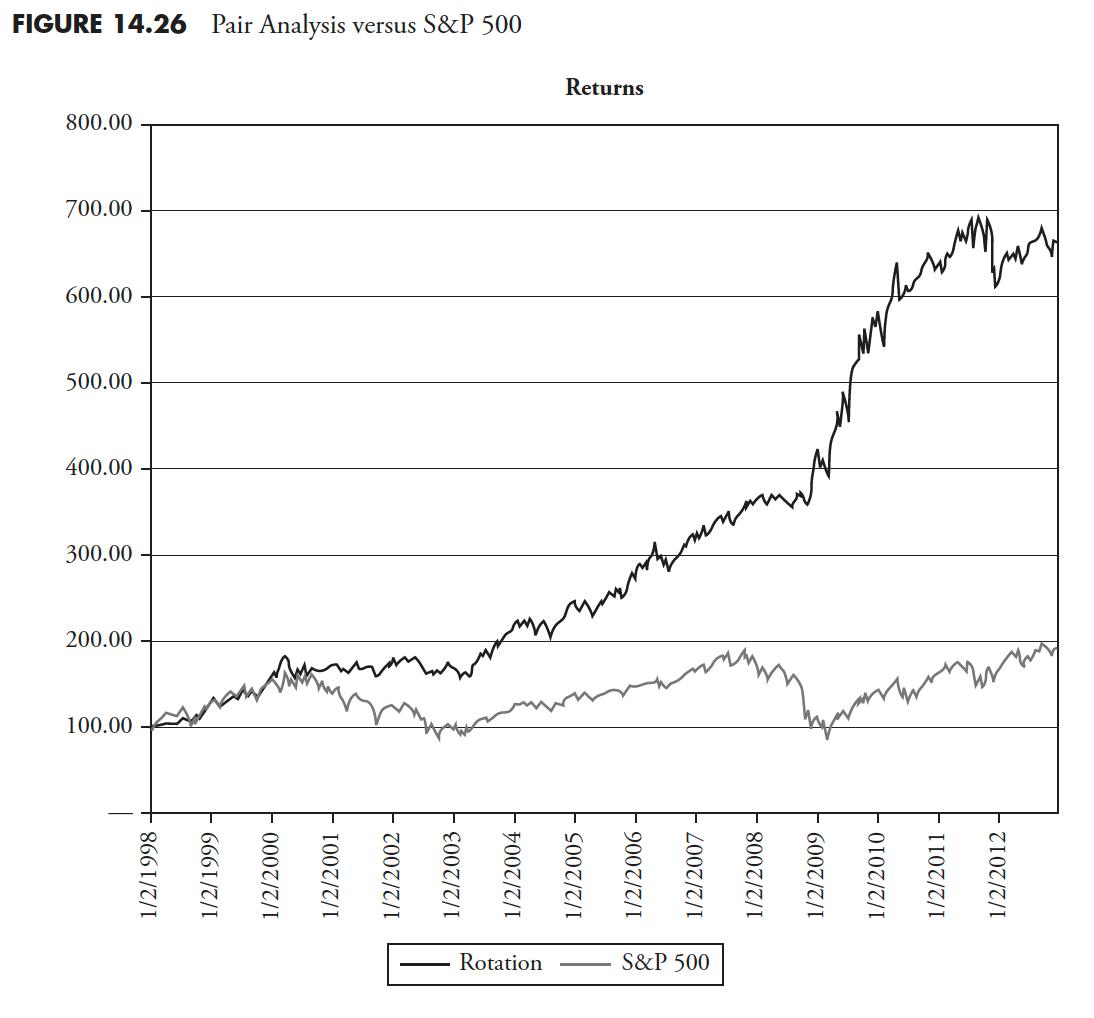
Table 14.4 shows the performance statistics for the Core Rotation Strategy (CRS) compared to the S&P 500. In this rotation strategy example, each of the pairs were smoothed by their two-period average prior to measuring the 4% rate of change. This process removes many of the signals and, while not affecting the results that much, reduces the number of trades significantly.
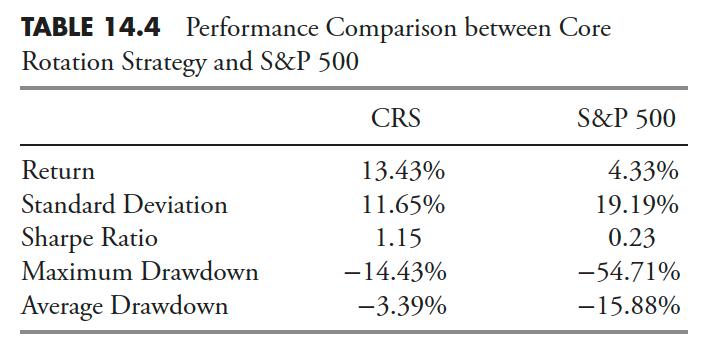
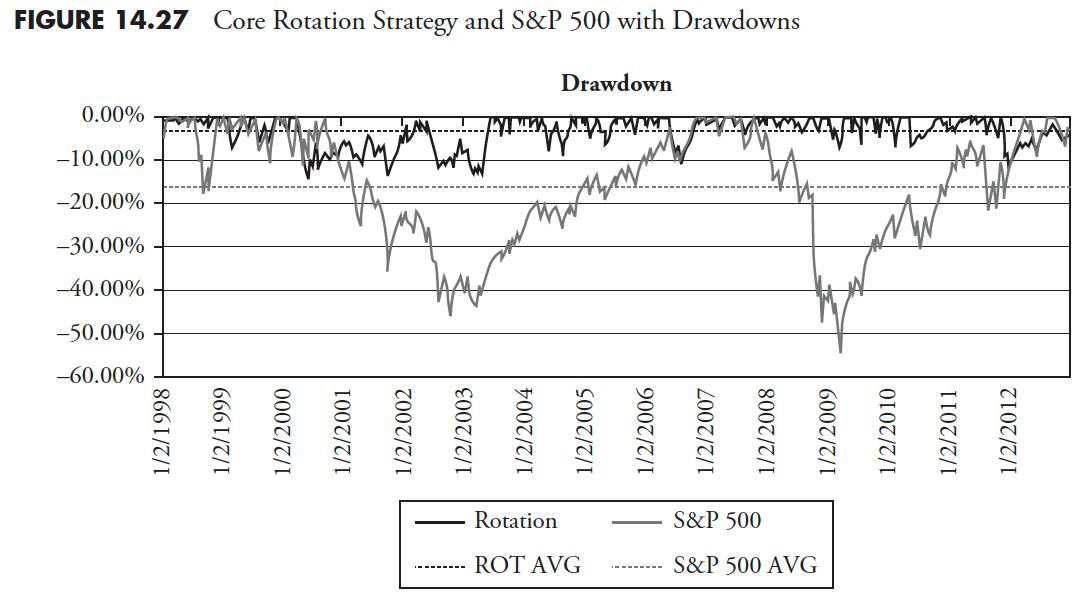
Figure 14.27 is the drawdown of the core rotation strategy compared to the S&P 500. You can see that the cumulative drawdown for the rotation strategy is considerably less than the drawdown of the index. The average drawdown for the rotation strategy was -3.39%, while the average drawdown for the S&P 500 was -15.88%. This would make for a very comfortable core, considering the exceptional returns and reduced risk statistics from just holding the index in a buy-and-hold situation. This core rotation strategy still meets the requirement of an always invested core while actively switching between four pairs of equity, gold, and fixed income ratios.
 Ranking and Selection
Ranking and Selection is another critical component to a rules-based model. Once you have measured the market, you need to determine what to buy. This is the technical process of determining securities that meet the rules when the time to buy arrives.
Mandatory Measures
Once you have your collection of ranking measures, you need to determine which are to be used, along with the rules and guidelines as mandatory ranking measures. This means that you predefine the value range that they must be in before you can purchase that ETF. This is necessary to keep the subjectivity out of the process.
Tiebreaker Measures
Once you have determined your mandatory ranking measures, the remaining ranking measures are considered tie-breaker ranking measures. These are used to help in the selection process, especially when there are hundreds of issues that qualify based on the mandatory measures. You can further reduce these into categories if desired, such as frontline tie-breakers, those you use more often than the others.
Ranking Measures Worksheet
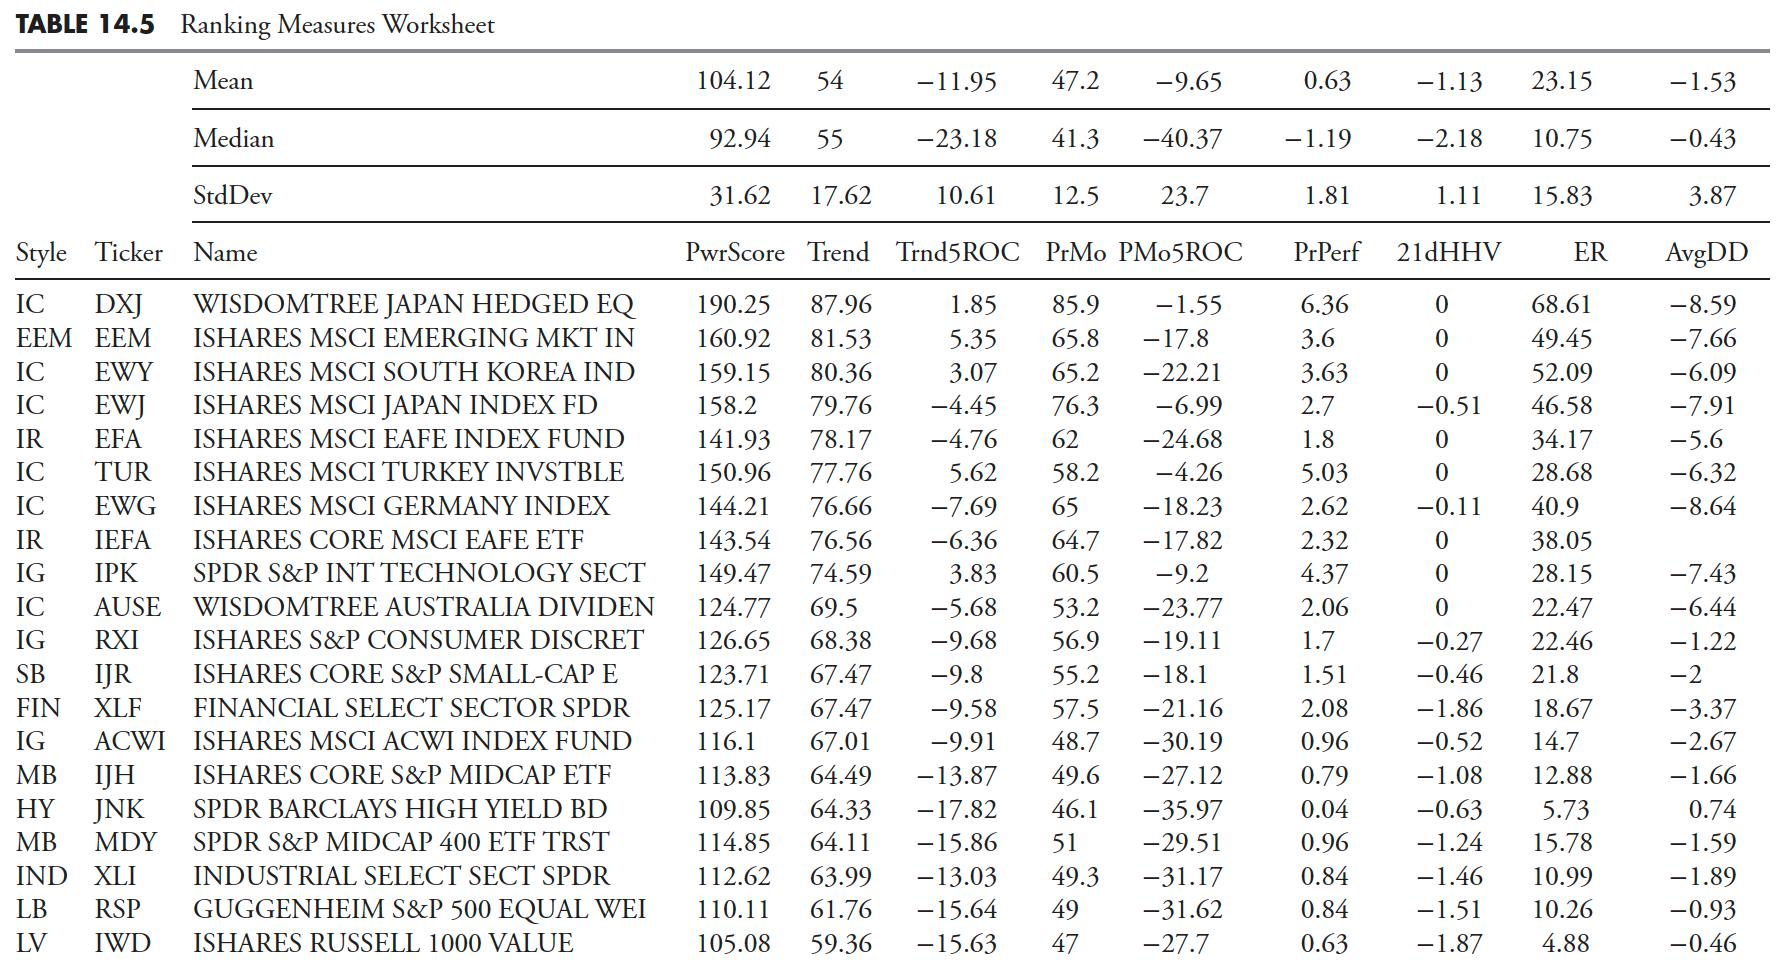
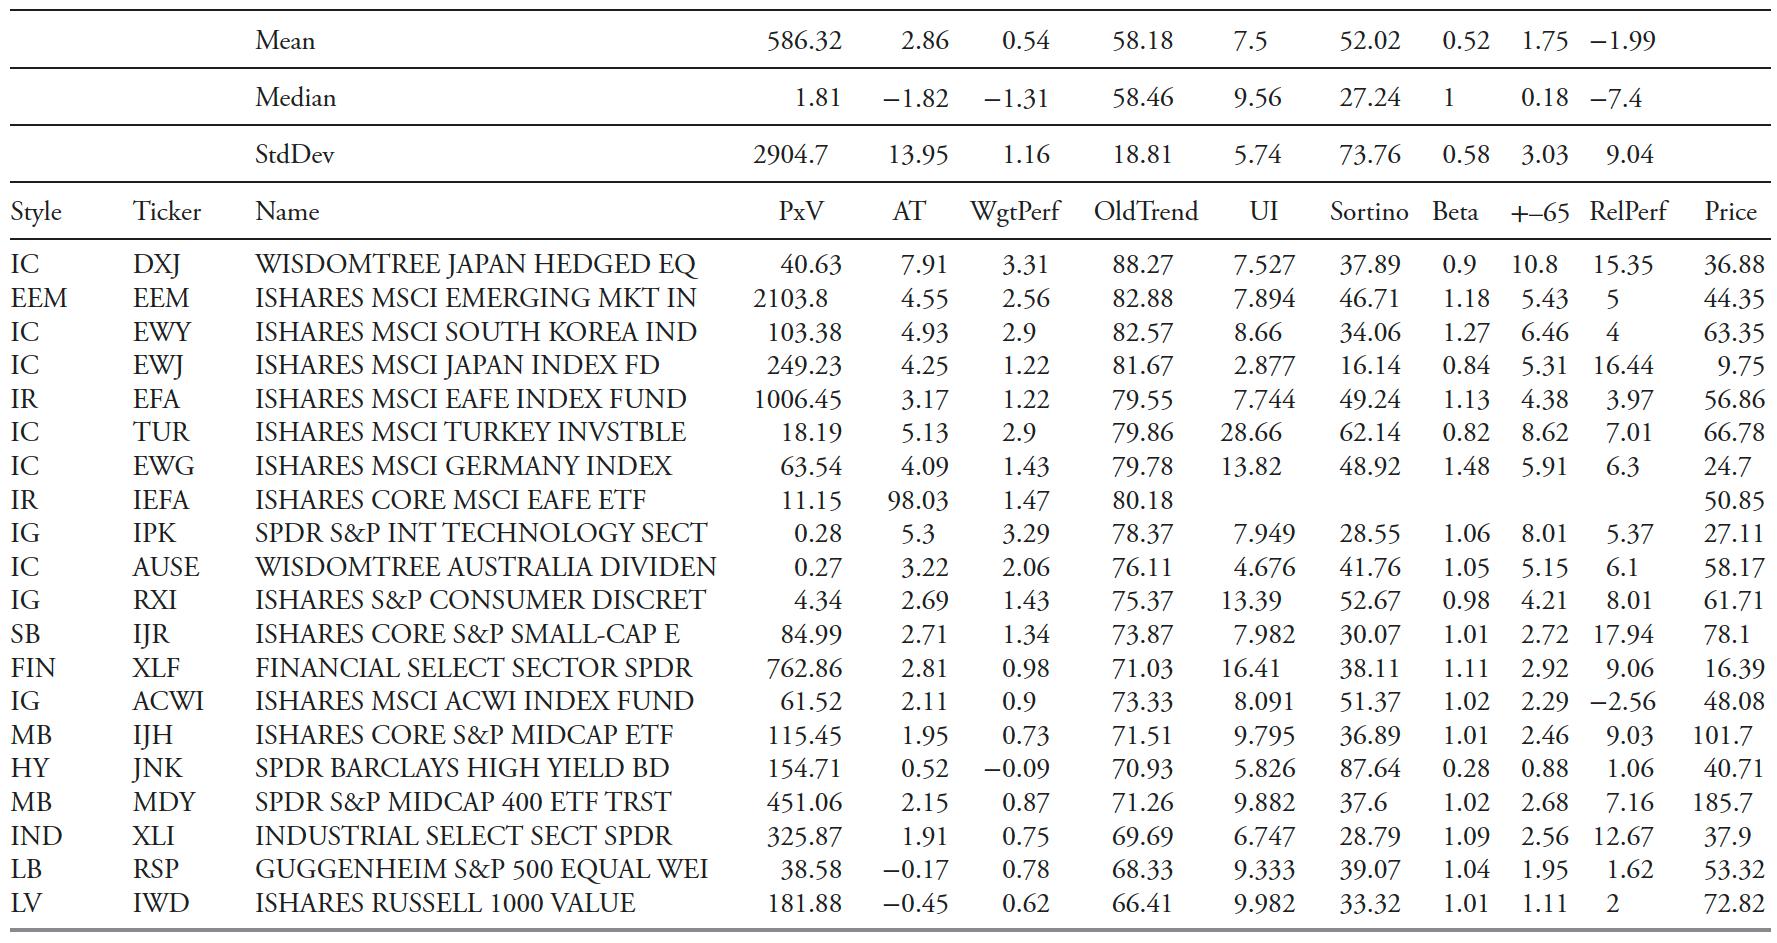
Table 14.5 is a partial view of the ranking measures worksheet. It only shows the top 50 to 60 issues as an example, since there are more than 1,400 ETFs in the full listing. One really important concept to grasp when looking at technical values in a spreadsheet is that you are only seeing a snapshot in time. Here is an example: let's say that the Trend value is of primary importance and you have two ETFs, one with a Trend of 60 and one with a trend of 70. Which would you choose? Well, the quick answer is probably 70 as that is a stronger trend measure than 60. However, don't you also need to know which direction the trend indicator is heading? If the trend that was at 60 was in an uptrend, while the one with the trend measure at 70 was in a downtrend, a completely different picture is presented. This is why all of the mandatory ranking measures also show their individual five-day rate of change, so that you can glean from the spreadsheet not only the absolute value of the ranking measure, but also the direction it is headed. It should be noted that any short-term period for rate of change will work.
Ranking Measures Are All About Momentum
Throughout this chapter it should be obvious that the ranking and selection process is centered on the concept known as momentum. Simply said, I want to buy an ETF that exhibits an upward trend that is determined by a number of different technical measures.
A final thought on momentum is that every day, in almost every newspaper's business section, there is an excellent list of stocks to buy. It is called the 52-week new high list, or often stocks making new highs. If you were to only use this readily available tool, along with a simple stop-loss strategy, you would probably do much better at investing in the market. Sadly, many investors think about buying stocks like they think about buying something at Walmart, they look for bargains. Although this is a valid method also known as value investing, it is very difficult to put into action and seems better in theory. When you buy a stock, you buy it simply because you think you can sell it later at a higher price, I think momentum will work much better in that regard.
Rules and Guidelines
Rules and guidelines are a critical element to a good trend-following model. Once you have the weight-of-the-evidence measure telling you what the market is currently doing, the rules and guidelines provide the necessary process on how to invest based on that measure. If there was a simple answer as to why they are necessary, it is to invoke an objective approach, one that does as much as possible to remove the frail human element in the model. Rules are mandatory, while guidelines are not. That being said, if a guideline is to be ignored, one needs to ensure there is ample supporting evidence to allow it. Basically, the strategy I use is one of a conservative buyer and an aggressive seller.
After many decades in aviation and the always-increasing use of checklists, the rules and guidelines are no different for maintaining a nondiscretionary strategy than a checklist is for a pilot. In aviation, checklists grew in length over time because as accidents or incidents happened a checklist item was created to help prevent it in the future. There is an old axiom about checklists that said behind every item on a checklist, there is a story. Same philosophy goes for rules and guidelines in an investment strategy. A checklist (rules) ensures portfolio managers follow all procedures precisely and unfailingly. This overcomes the problem with experienced managers thinking they can accomplish the task and do not need any assistance. That attitude is costly.
Buy Rules
B1—If asset commitment calls for an amount greater than 50%, then only 50% will be committed, with the remainder the next day, ensuring objectives remain aligned. Forty percent can be the maximum per day if necessary for Guideline G6. This rule keeps the asset purchases to a maximum for any single day. It would not be prudent to go into the market at 100% on one day.
B2—No Buy Days are (1) FOMC announcement day, (2) First/Last day of calendar quarter, (3) days in which the market has reduced hours. FOMC announcement days are typically high-volatility days and the end/beginning of a quarter involves a lot of window dressing. Leave the noise alone.
B3—No buying unless 50 (this can also be a percentage) tradable ETFs (not counting non-correlated) have:
Weight of the Evidence = Weak: Trend>60, Intermediate: Trend>55, Strong: Trend>50
I call this the "soup on the shelf" rule. If you have been to a large grocery store lately and strolled down the aisle that has soup, you probably noticed there are thousands of cans of soup with hundreds of blends, styles, and so on to choose from. Now imagine your spouse has sent you to the store to buy soup. When you turn down the soup aisle, you notice they are essentially empty except for two cans of rhubarb turnip barley in cream sauce. You probably aren't going to buy any soup that day. The market is similar, especially during the early stages of an uptrend, there just isn't much to choose from. In addition, the early stages have stricter buying requirements, so the number of issues to pick from could be very small, if any. Because you never violate the rules, a rule to protect you during this period was created, hence rule B3.
B4—No buying on days when stops on current holdings are hit and assets sold. This is usually the first hint that the ensuing uptrend is faltering. It just doesn't make sense as a trend follower to be buying on the same day as you are selling something that has hit its stop. The argument that one holding might not be correlated is weak in this example, as, with proper trading up, weak holdings should have been previously traded.
B5—No buying on days when the Nasdaq or S&P 500 is down greater than 1.0% (the indices used need to be tied you what you are using in the trend measures). Simply put, this means that if the market as determined by the S&P 500 and/or Nasdaq Composite is down more than 1% during the day, something is wrong with the uptrend and it is better to not buy that day. An argument from bargain hunters or value investors would be that one would get a better price on that day if the uptrend resumed. I can't argue with that, but I 'm not a value investor or a bargain hunter. It seems many investors want to buy stocks at bargain prices and I can understand that. However, we are not buying soap at a discount store; we are buying a tradable investment vehicle whose price is determined by buyers and sellers. Moreover, you only want to buy what is going up.
Sell Rules
S1—If stops are hit with End of Day data and still in place at 30 minutes (this time period is based solely on your comfort level) after the open the next day, a sell is initiated; if not in place at the 30-minute point, the issue falls under intraday monitoring (see S2).
S2—Intraday monitoring of Price and Trend (between the hours of 30 minutes after the open until 60 minutes before the close) will invoke a Sell order sent to brokers for execution. Once an issue hits its stop, then a 30-minute period is allowed before it is sold. With the constant barrage of Internet and financial media trying to be first with breaking news, often the story is presented incorrectly, and it can have an effect on a large stock, an industry, or even a sector and cause a big sell-off. Usually, if the story was reported in error or incorrectly, and then reported correctly, the issue quickly recovers. Most of this happens in a very short period of time. The 30-minute rule will help avoid most of these short-term sell-off with quick recoveries.
S3—In a broad-based sell-off and stops are hit, holdings hitting stops can begin liquidating before the 30-minute limit.
S4—If a holding has experienced a sharp run-up in price, once it reaches a 20% gain, sell 50% of the holding and invest in another holding or a new holding. This is just a prudent way of locking in exceptional gains.
S5—Any holding that is still being held after experiencing S4, once a gap open (above previous day's high) occurs, can warrant a further reduction in the holding. Additionally, this can also anticipate a blow-off move or island reversal, while protecting most gains but still allowing for more upside, although with limited exposure. This is not a good process when trading only one issue, but is prudent when trading many issues with the ability to always find something else to trade.
Trade Up Rules
T1—With Weight of the Evidence strong: If stops are hit, but limited to single sector/industry/style, replace next day as long as the Initial Trend Measures are all indicating an uptrend.
T2—With Weight of the Evidence strong: If stops are hit on more than one sector/industry/style, reenter when Initial Trend Measures are all indicating an uptrend or Initial Trend Measures are improving, as long as there is no deterioration in the weight of the evidence.
T3—With Weight of the Evidence at an intermediate level: If stops are hit, but limited to single sector/industry group, replace next day as long as Initial Trend Measures are all indicating an uptrend.
T4—With Weight of the Evidence at an intermediate level: If stops are hit on more than a single sector/industry/style, the normal Buy rules apply.
T5—There is no trading up when weight of the evidence or initial trend measures are deteriorating. Clearly, in this situation, there is something not good about the uptrend and it is not a time to trade up.
Guidelines
Note: Guidelines are used as reminders and offer the opportunity to be ignored, but only after considerable deliberation and examining all other possibilities. The absolute most important guideline is the first one, G1.
G1—In the event a situation arises in which there is not a rule or guideline, a conservative solution will be decided on and implemented based on immediate needs. A new guideline or rule will be developed only after the event/conflict has totally passed. This is a critically important guideline to ensure the "heat of the moment" is not used to create or change a rule. The absolute worst time to create or change a rule is when you are emotionally concerned about something that just seems to not be working correctly. In the 1970s, the Navy F-4J Phantom jet had analog instruments and, compared to today's electronic technology, was antiquated. We had to memorize what we called initial action items for emergency procedures; these were designed to handle the quick and necessary steps to shut down an engine because of fire, no oil pressure, and so on. During simulator (talk about antiquated compared to now), many would pull the wrong lever or shut off the wrong switch during the emotional surge that comes with bright red flashing lights and loud horns. I was not excluded from that group, but found that, when something happened that required immediate action, winding the clock (they weren't electric back then) for a few seconds to rid yourself of the adrenaline rush would allow you to perform better during the procedure. Beside the reasons given for S1 previously, this falls in line with that thinking.
G2—Try to adhere to this if possible: Weak Weight of the Evidence: SPY, MDY, DIA (ensure liquidity); Intermediate Weight of the Evidence: Styles and Sectors; Strong Weight of the Evidence: Wide Open (a pilot term meaning full throttle). The mandatory ranking measures will dominate this guideline.
G3—European ETFs need to be monitored closely after 1pm Eastern Time to ensure adequate execution time. This is because when the Europe markets close, liquidity in those issues becomes a problem.
G4—Every day when invested, trading up needs to be evaluated. Often, this involves selling the poor-performing holding and buying additional amounts of current holdings.
G5—All buy candidates should be determined by A) rising mandatory ranking components using a chart of the Ranking Measures, and B) an awareness of the issue's price support and resistance levels.
G6—Always be aware of the Prudent Man concept. This is sort of a catchall to make one think about an action that has not been adequately covered with rules or guidelines. If deciding to do something as far as asset commitment or ETF selection, one needs to be prepared to stand in front of the boss and explain it.
There are a host of additional rules and guidelines that can be created. I would caution you on trying to develop a rule for every inconsistency or disappointment that surfaces while trading with a model. There is probably a good equilibrium about the depth and number of rules is best. I strongly suggest adding rules rationally and unemotionally.
Asset Commitment Tables
In addition to measuring what the market is doing (weight of the evidence) and a set of rules and guidelines to tell you how to invest based on what the market is doing, you then need a set of tables for each strategy to show you the asset commitment (equity exposure goal) levels to be invested to for each Weight of the Evidence scenario.
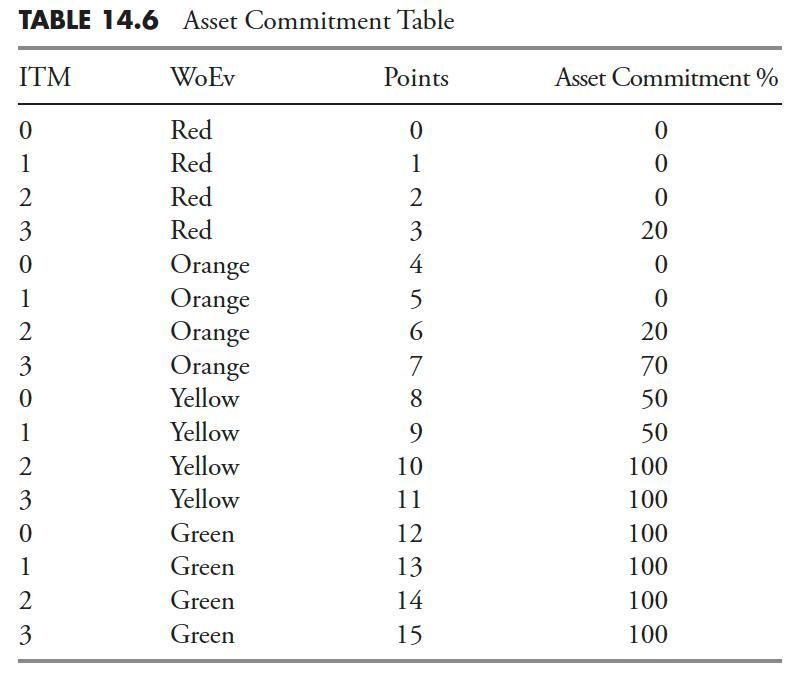
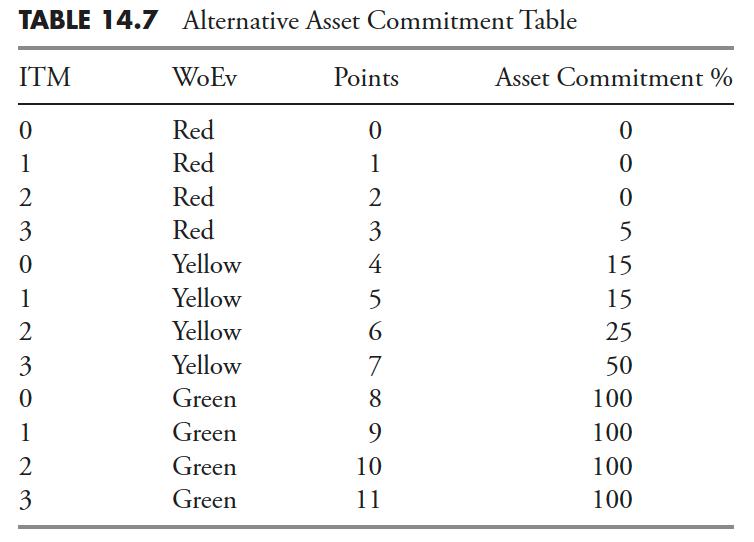
Table 14.6 is an example table showing the Initial Trend Measure Level (ITM), Weight of the Evidence (WoEv), the Points assigned to each level, and the Asset Commitment Level Percentage (Asset Commitment percent). This is merely a sample and should be based on your risk preferences and objectives. As you can see, even with the WoEv at its lowest level, as long as the much shorter-term trend measures (ITM) are all saying there is an uptrend, one can commit equity to the market.
An alternative and more conservative asset commitment table is shown in Table 14.7. It is easier and a more simple process to divide the WoEv into only three levels, with the middle or intermediate level being the transition zone.
The rules and guidelines offer a few exceptions to the above table of asset commitment, but only based on fairly rare events. Following the rules and commitment levels will lead to an objective process, which is the ultimate goal.
This article contains many measures one can use to determine which holdings should be bought. Many are only valuable in assisting in the selection process. If you consider the fact that you might only need to purchase a few holdings and there are more than 1,400 available, you need a strong set of technical measures to help you reduce the number of issues into a more manageable number. There are some that were identified as mandatory measures, which means these are the ones that have the best track record at identifying early when a holding is in an uptrend. I am positive there are many momentum indicators that are not in this chapter, but these are the ones that I have used for many years. Just keep in mind what the goal of this is: to remove human input into the selection process.
Thanks for reading this far. I intend to publish one article in this series every week. Can't wait? The book is for sale here.
