Healthcare is not exactly a leading sector right now, but the Health Care SPDR (XLV) sports a big triangle breakout on the weekly chart and this breakout is holding. Note that SPY, XLK, XLY and XLP hit new highs in July and these are the chart leaders right now. Even though XLV is not leading per se, it is on my radar because a Reversal Alert Zone (RAZ) is in play on the daily chart. The same is true for the Biotech SPDR (XBI). XBI is not leading, but hitting a RAZ.
We will start with an exercise in multiple timeframe analysis. The weekly chart shows unadjusted XLV (_XLV) hitting new highs in 2018 and then moving into a triangle consolidation from late November to early June. A consolidation after a new high is typically a bullish continuation pattern and the stock broke out with a surge above 92 in June. XLV stalled after the breakout, but the breakout is holding and remains the active signal.
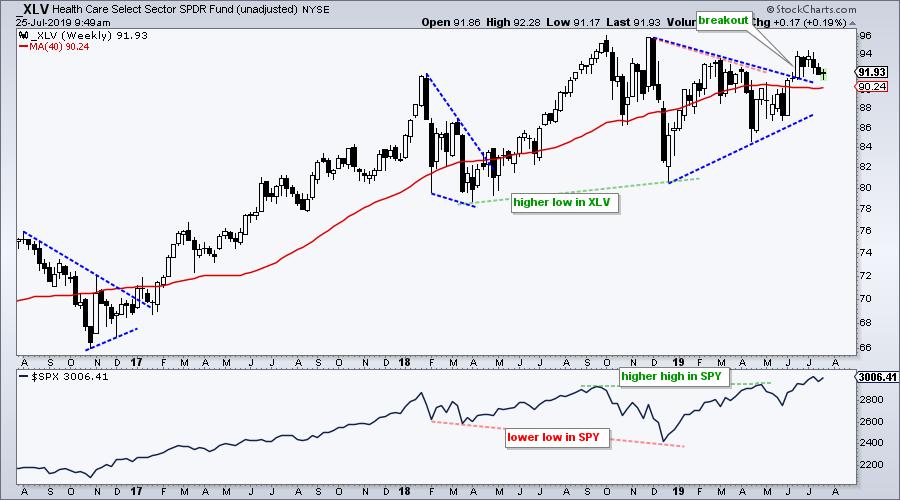 XLV Weekly
The next chart shows a shorter timeframe for more granularity. XLV broke out in June and fell back to the breakout zone in July. This puts XLV near a Reversal Alert Zone (RAZ) and puts me on alert for an upturn. The RAZ is defined by broken resistance turning support, the flattening 200-day SMA, support from the late June low and the 38-50% retracement zone. This is an area to watch for firmness and an upside breakout of the falling wedge.
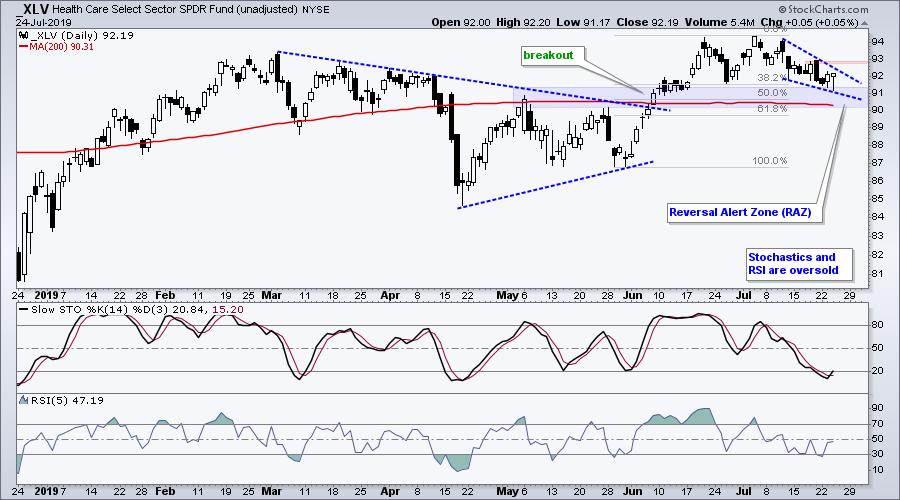 XLV Daily
Follow me on twitter: @arthurhill
Email comments: arthurh@stockcharts.com
The Biotech SPDR (XBI) reversed at the big Reversal Alert Zone (RAZ) in June with a breakout and then returned to the breakout zone here in July. Even though XBI is seriously underperforming, a smaller RAZ is at work and I am watching for a breakout at 87. Broken resistance turns support in the 84-85 area. Support in this area is confirmed by the late June low. The zone also marks a 50-61% retracement of the prior advance and a falling wedge formed. XBI is setting up and I am watching closely.
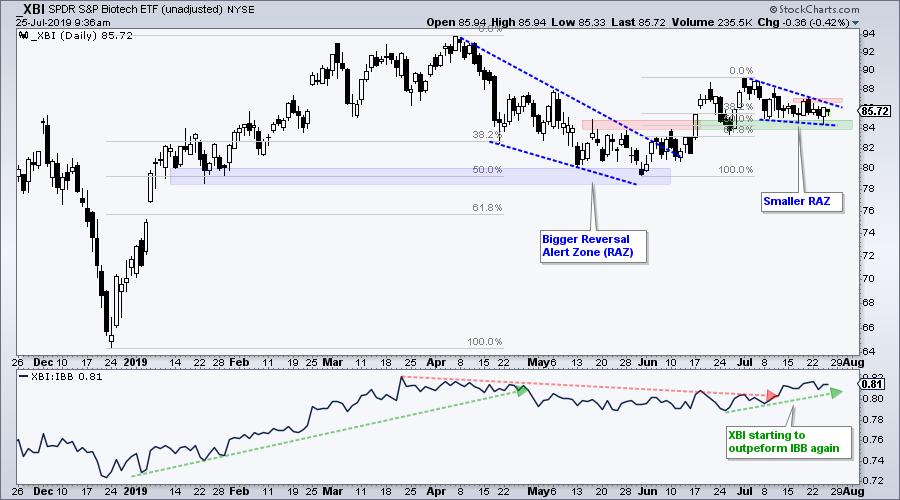 XBI RAZ
On Trend on YouTube
Today's show starts with the State of the Stock Market. I review the key breadth indicators for the indexes and sectors. There was a new signal from Mid-Cap %Above 200-day EMA (!GT200MID). We also review the breadth and price charts for XLI, XLV and XLF. I then turn to the leading ETFs, which are those making new highs in July. And finally, it is hard to ignore the Reversal Alert Zones (RAZ's) in the biotech ETFs, even though they are seriously underperforming lately.
On Trend for Thursday, July 25th
Choose a Strategy, Develop a Plan and Follow a Process
Arthur Hill, CMT
Chief Technical Strategist, TrendInvestorPro.com
Author, Define the Trend and Trade the Trend
Want to stay up to date with Arthur's latest market insights?
– Follow @ArthurHill on Twitter
