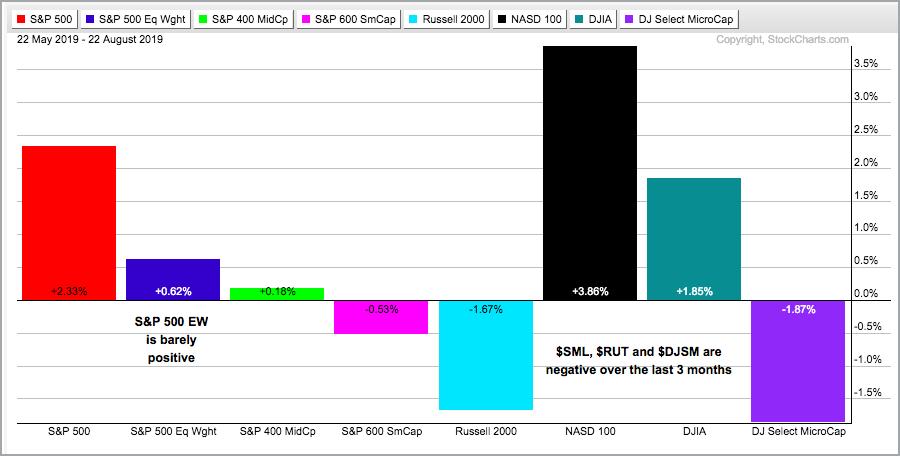
 The performance for the S&P 500, S&P Mid-Cap 400 and S&P Small-Cap 600 over the last 3, 6, 9 and 12 months pretty much says it all. The S&P 500 is positive on all four timeframes, the S&P Small-Cap 600 is negative on all and the S&P Mid-Cap 400 is mixed. Mr. Market is about as split as can be. The chart below shows 3-month performance for eight stock indexes and the overall picture is mixed. The S&P Small-Cap 600, Russell 2000 DJ Microcap Index are negative, while the S&P Mid-Cap 400 and S&P 500 Equal-Weight Index are barely positive. The S&P 500, Nasdaq 100 and Dow are up and doing the heavy lifting.
Even though the S&P 500 is positive on the 9 and 12 month timeframes, there was a sizable dip in the fourth quarter of 2018 and the index was down 19.78% from its September closing high on December 24th. Yes, the index was .23 away from bear market territory (down more than 20%) and rallied back with a vengeance. Sorry, but you cannot measure correction territory or bear market territory with a simple percentage move in one index.
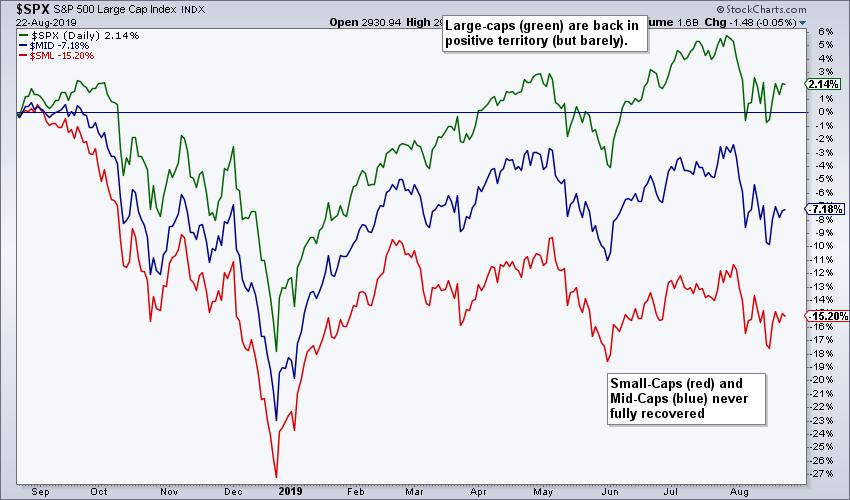
The chart above shows one year performance for these three since August 2018, which is when the S&P Small-Cap 600 peaked. Despite double digit gains since the December low, the S&P Small-Cap 600 (red line) and S&P Mid-Cap 400 (blue line) never fully recovered from last year's decline. The S&P 500 turned positive again in April and again this summer, but it is up just 2.14% over the past year. It would not take much to turn the 1-year Rate-of-Change negative again.
------------------------------------------------------------
S&P 500 Remains in Uptrend
Technically, the S&P 500 SPDR (SPY) remains in a long-term uptrend. The index hit a new high in late July and remains well above the prior reaction low (trough in early June). Thus, price action still shows higher highs and higher lows. In addition, the 20-day SMA is above the 200-day SMA and price is above the 200-day SMA. The S&P 500 breadth indicators are still net bullish, but the Index Breadth Model is net bearish because of mid-caps and small-caps (see below). What a mess!
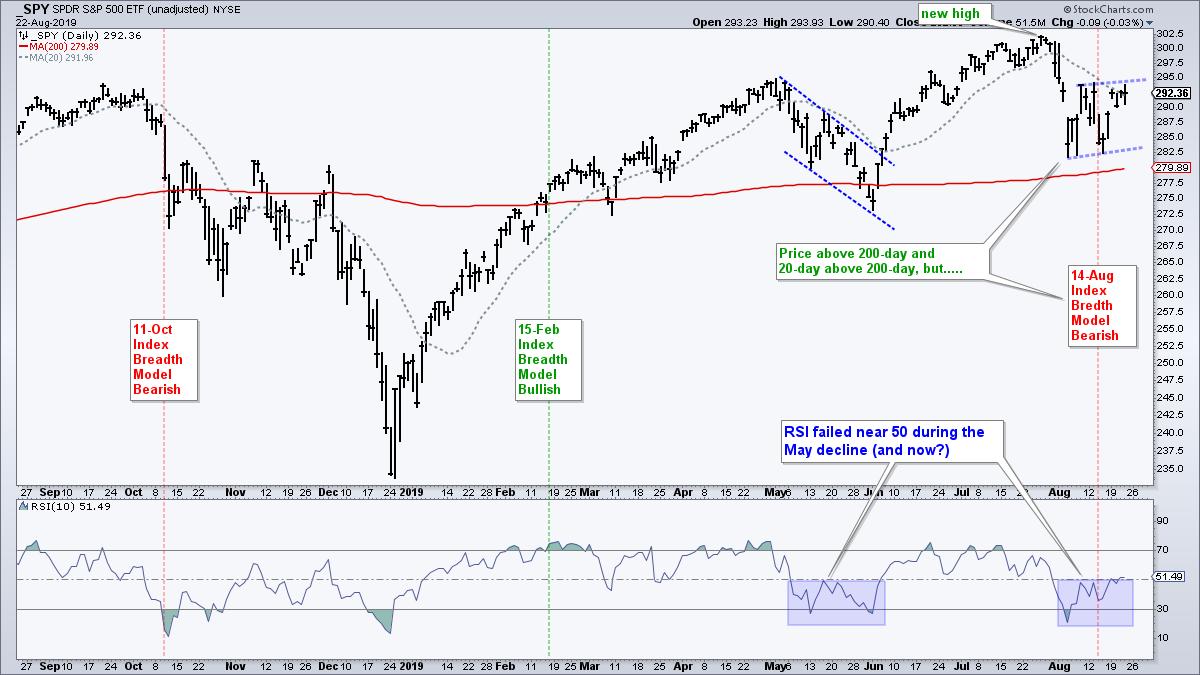
Short-term, anything could happen and only active intraday traders should be active, which does NOT include me. Trading has turned quite choppy here in August and some guy named Powell is speaking in some place called Jackson Hole. After the sharp decline in early August, the index consolidated with a rising flag type pattern. SPY is holding near the top of this range after a two day bounce. There is some resistance in the 295 area from the mid August highs and 50-day SMA (not shown). In addition, RSI is near 50, which is the make-or-break area for a short-term bounce.
------------------------------------------------------------
Attack of the 80% Up/Down Days!
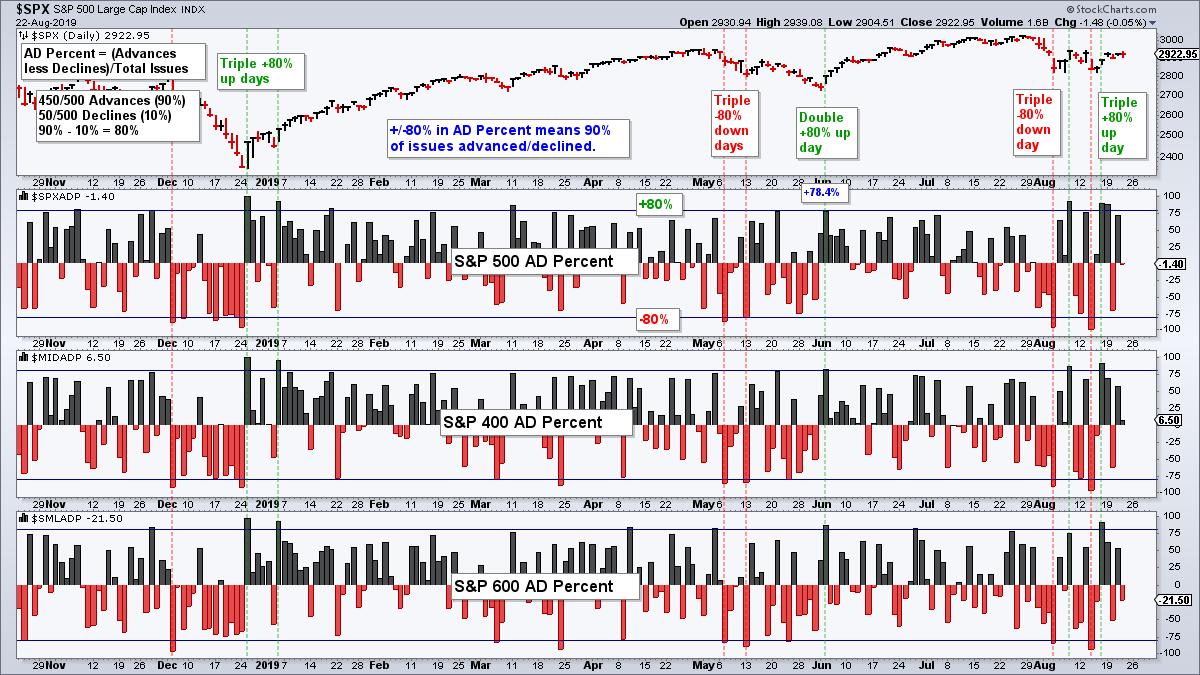
There have been four triple 80% up/down days over the last four weeks, but we have yet to see follow through. A triple 80% day occurs when 90+ percent of component stocks advance/decline on a single day (90% advances - 10% declines = +80% AD Percent). Stocks bounced after the triple 80% down day on August 5th and then fell back after the triple 80% up day on August 8. Once again, stocks bounced after the triple 80% down day on August 14th and then stalled after the triple 80% up day on August 16th. Despite big breadth moves in both directions, lack of follow through kept the S&P 500 range bound over the last three weeks.
------------------------------------------------------------
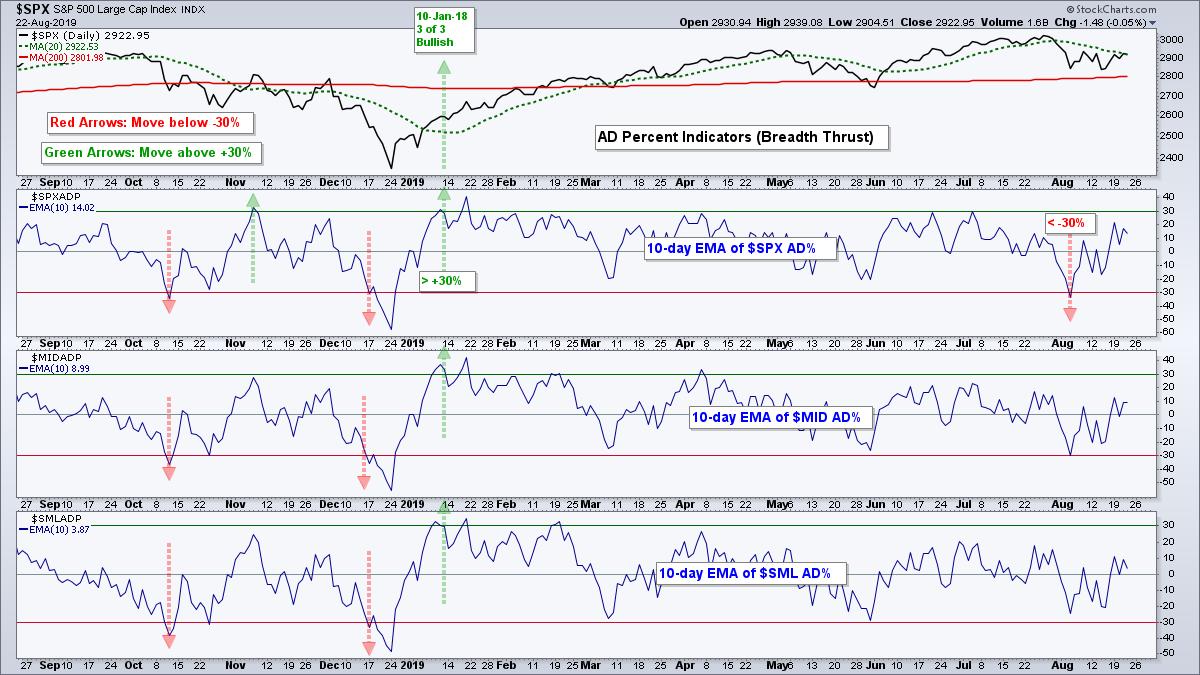
January Breadth Thrust Signals Remain
I smooth out the daily AD Percent values with a 10-day EMA for medium-term signals in my index breadth model. A bullish signal occurs with a move above +30%, while a bearish signal triggers with a move below -30%. All three indexes triggered bullish breadth thrusts in early January. The 10-day EMA of S&P 500 AD Percent ($SPXADP) triggered a bearish breadth thrust on August 5th, but the S&P Mid-Cap 400 and S&P Small-Cap 600 did not. $MID came close though. As a group, this breadth thrust indicator is still net bullish because two of the three are on bullish signals.
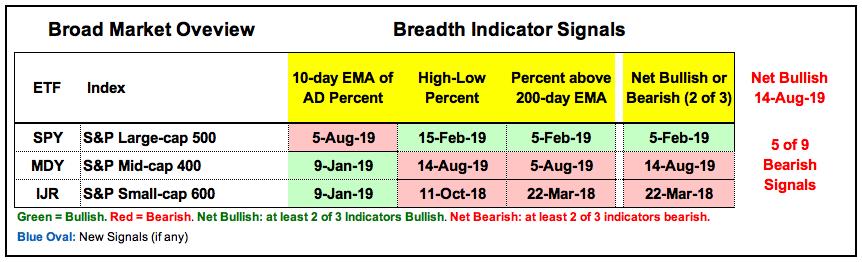
There is no change in the Index Breadth Model with five of the nine indicators remaining on active bearish signals. Blame High-Low Percent and %Above 200-day EMA. The S&P 500 is still net bullish with two of the three indicators on active bullish signals, but the S&P Mid-Cap 400 and S&P Small-Cap 600 remain net bearish. This suggests that the broader market is split right now with a bearish tilt (5/9 = 55.55%).
You can learn more about these indicators with the following links: AD Percent, High-Low Percent, %Above 200-day EMA and YouTube video covers all three.
------------------------------------------------------------
One New Sector Signal
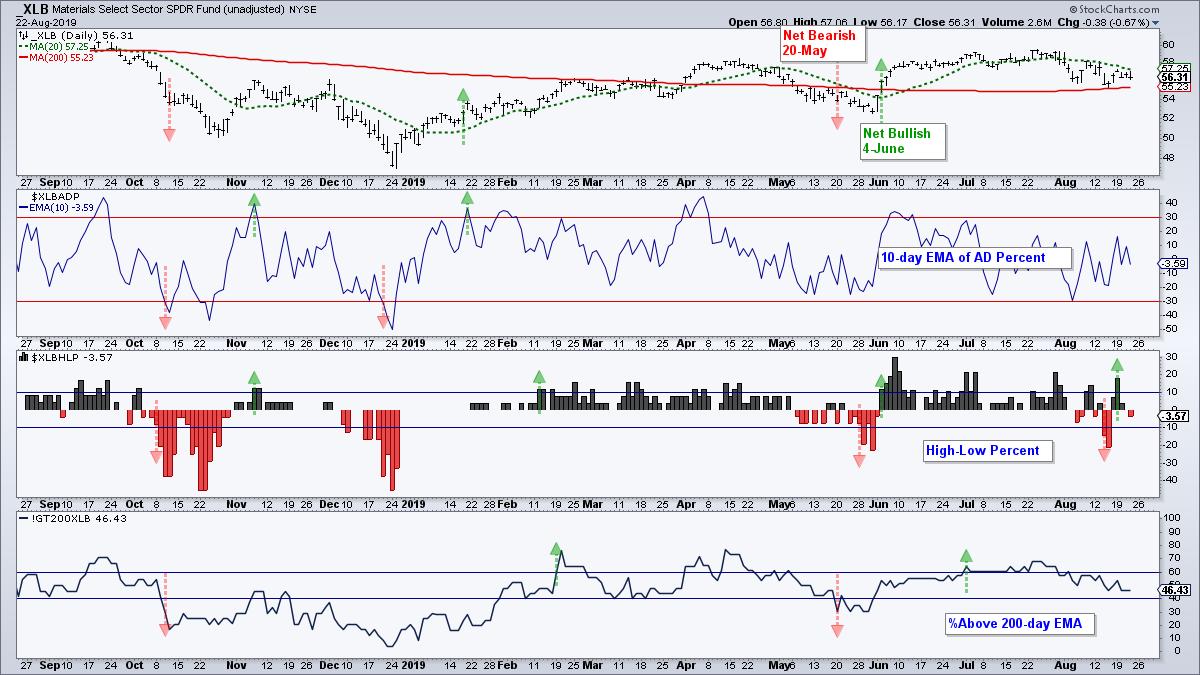
There is not much change in the Sector Breadth Model with only one new signal the smallest sector. XLB High-Low% ($XLBHLP) moved above +10% to reverse its bearish signal from the previous week. This happens with sectors with a small number of stocks. With 28 stocks, XLB only needs 3 new highs for XLB High-Low% ($XLBHLP) to exceed +10%. Furthermore, the sector really is a hodgepodge of stocks: chemicals, mining, steel, construction materials and containers & packaging. I am not sure if the last group really belongs (BLL, AMCR, AVY, PKG, WRK, SEE, IP). What does Packaging Corp of America have in common with Freeport McMoran or Nucor?
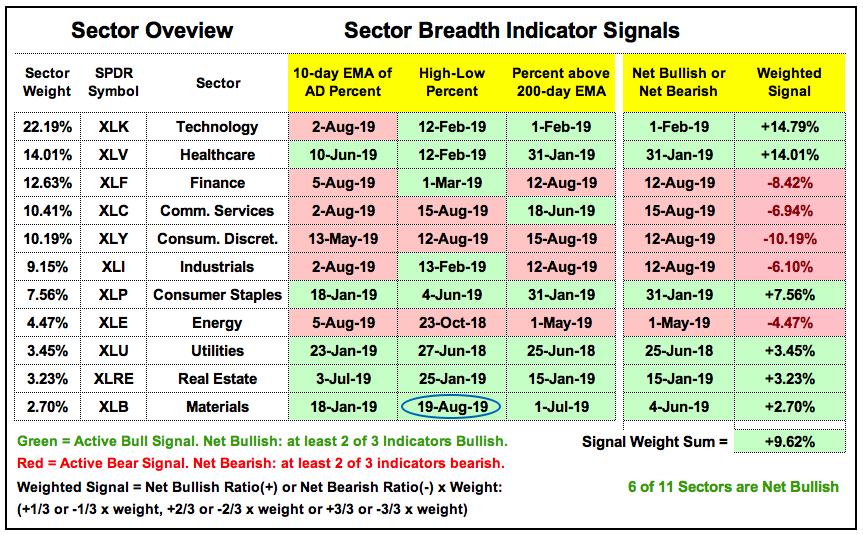
XLB only accounts for a measly 2.70% of the S&P 500 and has little effect on the Sector Breadth Model, and the broader market for that matter. The Sector Breadth Model reflects a split market (S&P 500) with a slight bullish tilt. 6 of 11 sectors are net bullish, but four of the five offensive sectors are net bearish (Finance, Communication Services, Consumer Discretionary and Industrials). On a positive note, the biggest sector (Technology 22.19%) and the second biggest sector (Healthcare 14.01) remain net bullish, as do the three defensive sectors (Utilities, REITs, Staples). The sum of the weighted signals is still positive (+9.62%) and this suggests a bullish tilt to the S&P 500. Note that this sum ranges from -100% to +100%. Thus, +9.62% puts it in the lowest positive decile.
Note that the sector breadth indicators measure the internal strength or weakness within a sector. All stocks are equal when it comes to breadth indicators and these indicators reflect sector performance as a whole. The sector SPDRs, on the other hand, are weighted by market cap and all stocks are NOT created equal. These ETFs reflect the performance of the largest stocks within the sector (large-caps).
------------------------------------------------------------
Bottom Line: Bear Market Environment
The S&P 500 SPDR (SPY) and Technology SPDR (XLK) are in a long-term uptrends and their breadth indicators are net bullish. This alone tells us that conditions are not that bad right now. The S&P 500 accounts for some 80% of the total US stock market and Technology represents the biggest sector in the index.
The broad market environment deteriorates when we look further. The breadth indicators are net bearish for the S&P Small-Cap 600 and S&P Mid-Cap 400, as well as for the Industrials, Finance, Consumer Discretionary and Communication Services sectors. Weakness in small-caps and mid-caps is not that big of a deal, but weakness in these four S&P 500 sectors is a big deal.
At the very least, I cannot be fully bullish on the broader market. In other words, it is clearly NOT a bullish market environment right now. Whether or not it is a bearish market environment is open for debate, but I will stick with the bear market environment until the evidence improves. Either the Technology sector flips bearish and we move to a clear bear market environment or the other four offensive sectors start turning and small-caps improve.
This split market tells me that it is an ETF and stock picker's market. Strong stock-related ETFs include the Utilities SPDR (XLU), Real Estate SPDR (XLRE), Consumer Staples SPDR (XLP), Home Construction iShares (ITB), Medical Devices ETF (IHI), Aerospace & Defense iShares (ITA) and Solar Energy ETF (TAN). Click here for commentary and charts covering the leading and lagging ETFs.
------------------------------------------------------------
Choose a Strategy, Develop a Plan and Follow a Process
Arthur Hill, CMT
Chief Technical Strategist, TrendInvestorPro.com
Author, Define the Trend and Trade the Trend
Want to stay up to date with Arthur's latest market insights?
– Follow @ArthurHill on Twitter
