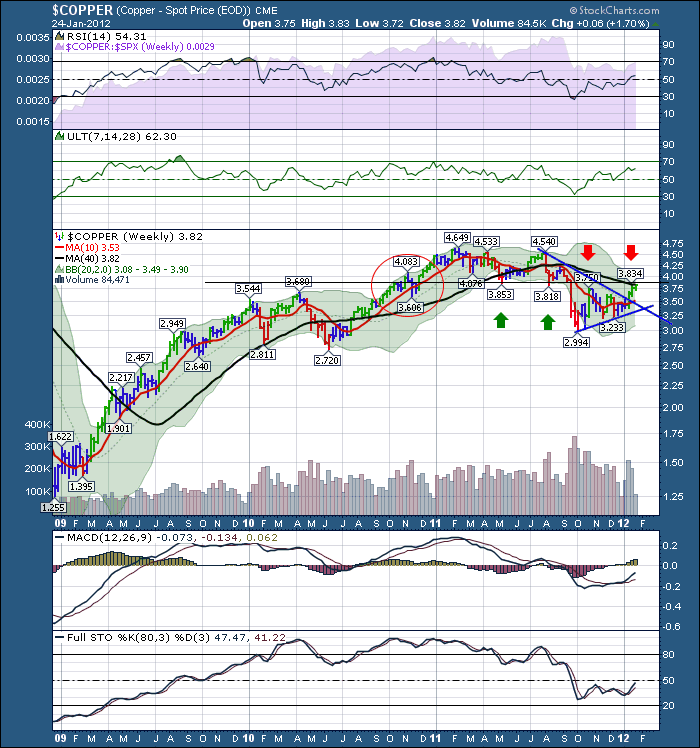
Here is the $COPPER weekly. Notice the thin black line right at this $3.80 level.
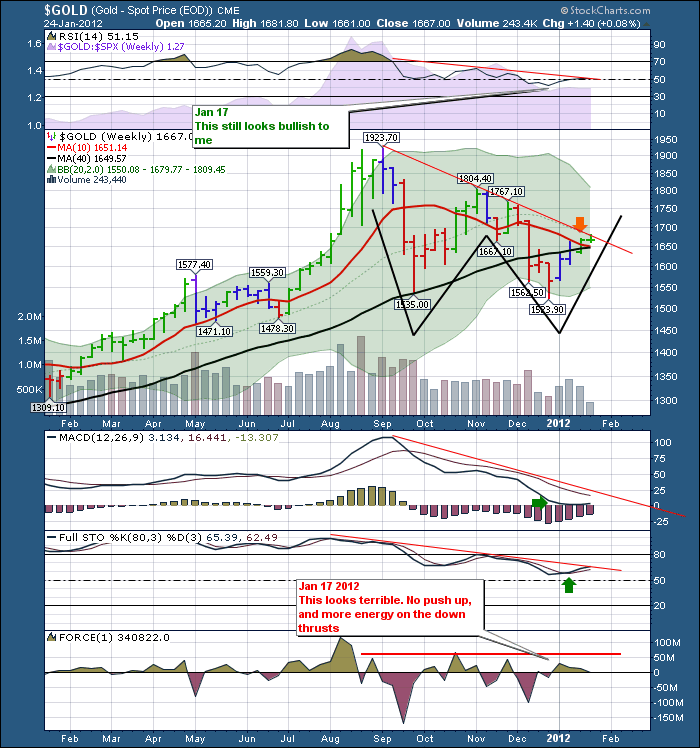
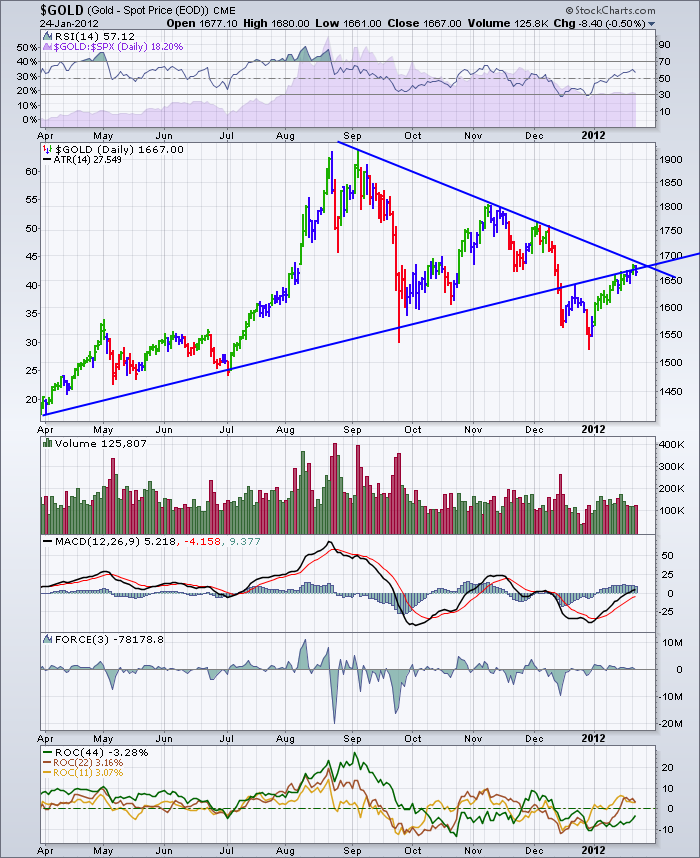
Here is $GOLD.
Gold is right at the junction of the 10 week (50 day ) Moving average, the 40 week ( 200 day) ma, and the downtrend line. It is also constructing a double bottom base pattern which is bullish.
But it is also at a few other interesting lines.
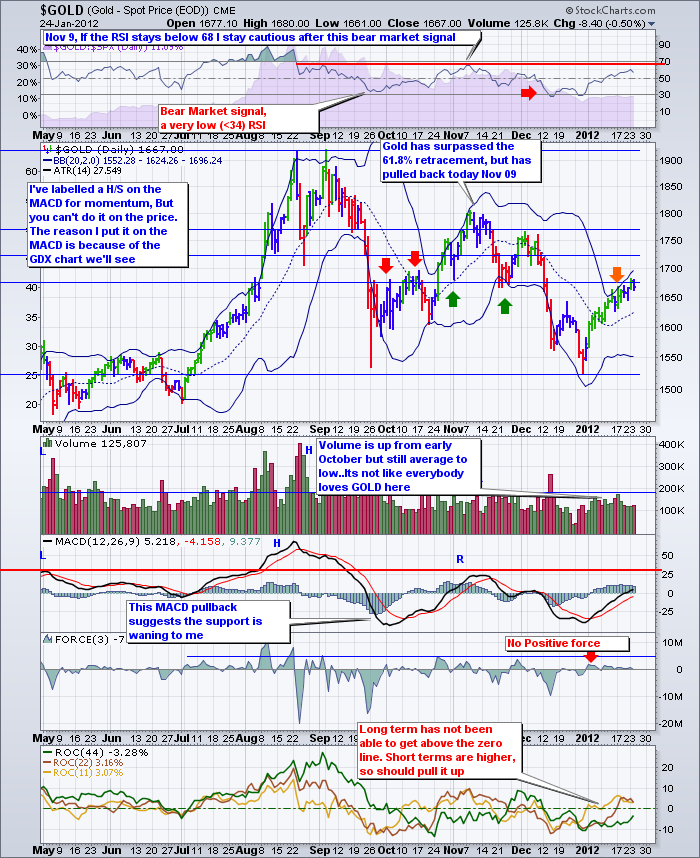
Notice how the price spent 6 weeks in between the 3 fib lines after the end of October. The Fib baseline waas moved down to the December low, but the October low was similar. My eyes are drawn to the horizontal line with 4 reversals marked by arrows and we are currently at that level again.
That line is one of the Fibonacci levels.
What else could be going on! Check it out on the cleaned up chart. It is also backtesting a break down through an upsloping trendline. Sometimes this can be a reversal point. It is also at the APEX of the triangle.
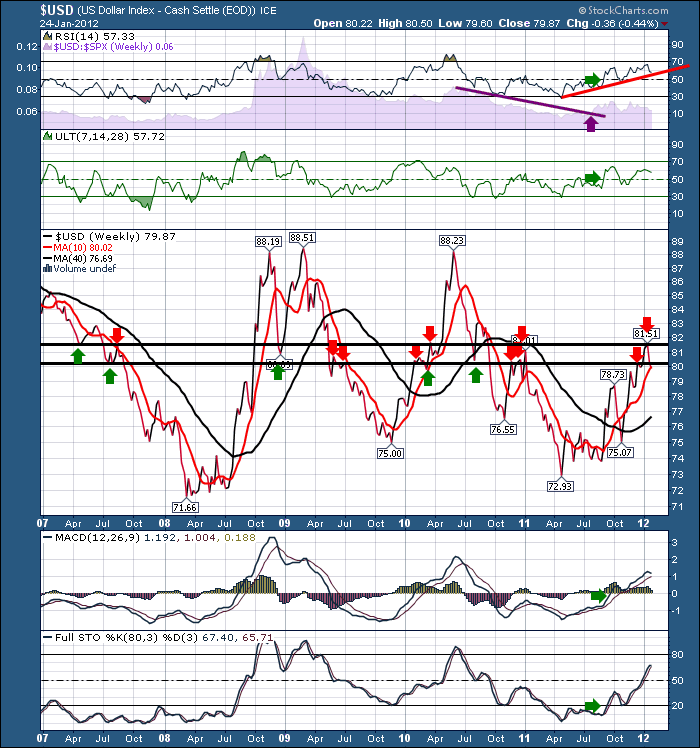
Now check out the $USD. Check out this support / resistance zone.
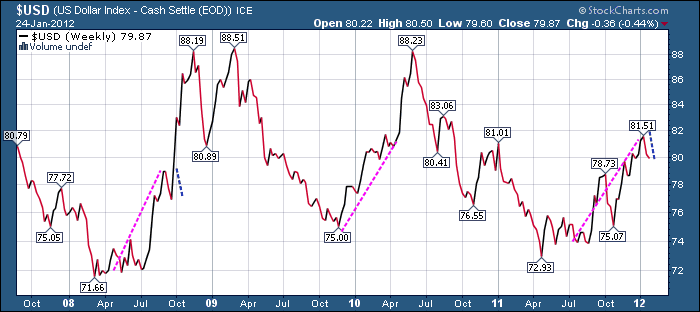
15 different reversals within this zone. I do have one more thing I'd like to point out on the $USD.Same chart, lets strip everything else off it.
The two previous times the USD has made a move off the lows, it went on an exceptional surge higher of almost double the move after a consolidation. In 2008 it paused halfway with a pullback only to soar higher. In 2010 it paused halfway with a sideways wobble in Feb/March, before going vertical. After the strong move off the bottom, the $USD has retraced after a similar distance.
Where are we headed now? I don't know but these three charts are all at places where everything could turn from the recent trend.
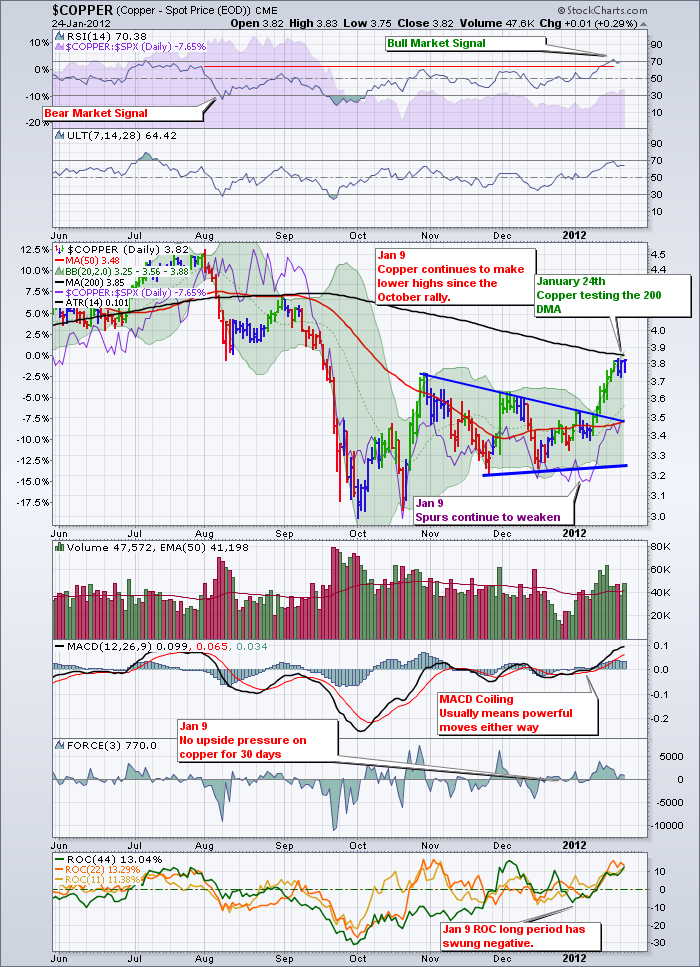
One of my comments on the copper chart was that $COPPER was taking off one way or the other from the coiling MACD. It was definitely higher! Can it blow right through the 200 DMA? Can GOLD blow right through the 200 DMA?
The USD looks like it has put in enough of a pullback compared to the other two moves in the last 5 years to make it's next move higher! If the USD soars higher, that will stop the moves of both gold and copper. Stay Tuned!
As a footnote, I got a sell signal for the stocks in general based on Monday's data on a group of indicators I like to use. So far Tuesday data confirmed it.Will the great results from AAPL spur more confidence or will the market just continue to churn at these levels. The Nasdaq has made no real progress the last 4 trading days.
Stay focused, the technicians are are calling tops here. Tom Demark was the 2011 Global Technical Analyst of the Year. He suggests the top is here. Others say we have just moved above the 200 DMA on the SP500 and that means get bullish! Has the stock market topped? The battle lines are definitely drawn on these three charts. The Dow is testing the top of it's 2011 highs. The NDX has broken through to new highs. The TSX is still well below the 200 DMA. The SPX has a ways to go. Grab the popcorn and stay keenly aware of what happens here.
Good Trading,
Greg Schnell, CMT

About the author:
Greg Schnell, CMT, MFTA is Chief Technical Analyst at Osprey Strategic specializing in intermarket and commodities analysis. He is also the co-author of Stock Charts For Dummies (Wiley, 2018). Based in Calgary, Greg is a board member of the Canadian Society of Technical Analysts (CSTA) and the chairman of the CSTA Calgary chapter. He is an active member of both the CMT Association and the International Federation of Technical Analysts (IFTA).
Learn More
