The Canadian Technician September 29, 2012 at 04:19 AM
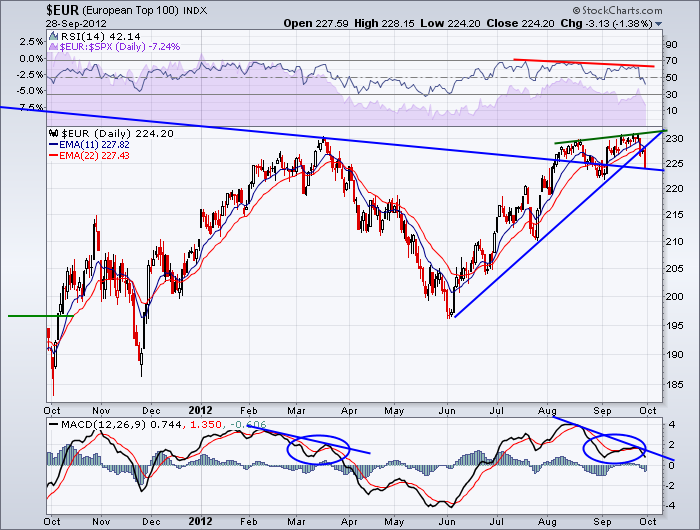
Here is a good example of pattern recognition in my mind. Notice the similarities of the indicators at the March highs and the current highs. This chart is the index for the top 100 Euro companies... Read More
The Canadian Technician September 26, 2012 at 11:25 AM
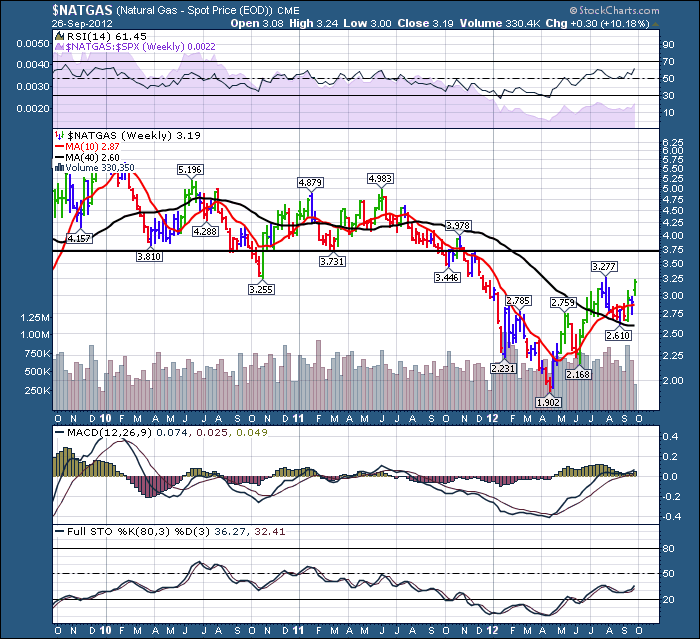
Up in Canada the onset of October starts to bring some cooler nights and the fireplaces get lit. The furnaces have been kicking in with the alarm clocks to take the chill out of the morning air... Read More
The Canadian Technician September 25, 2012 at 06:05 AM
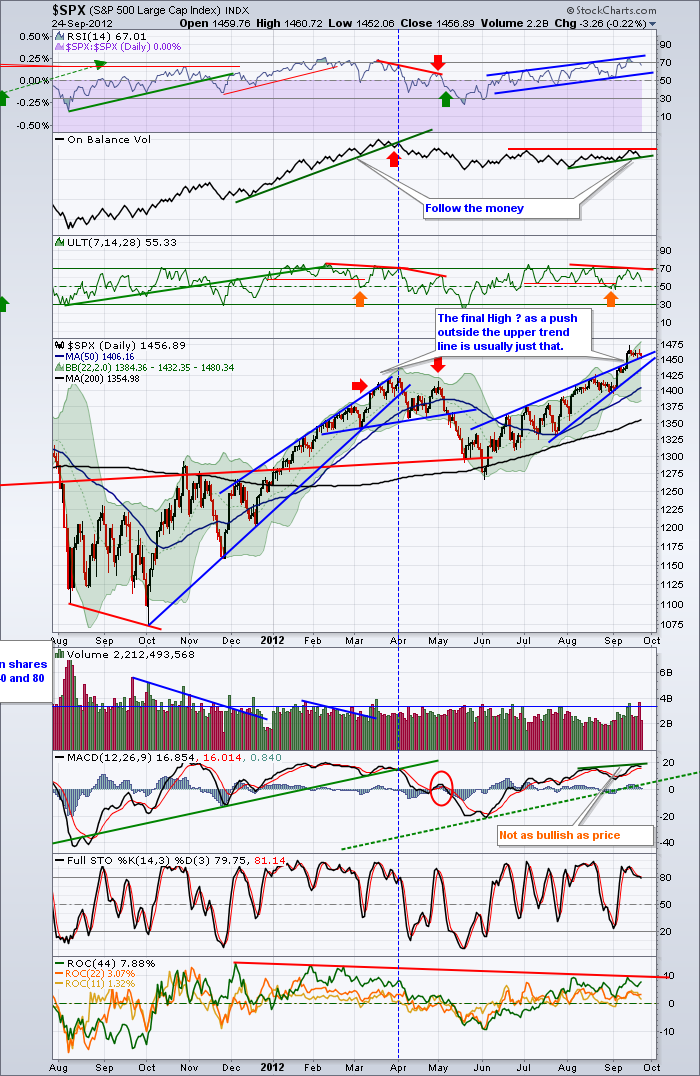
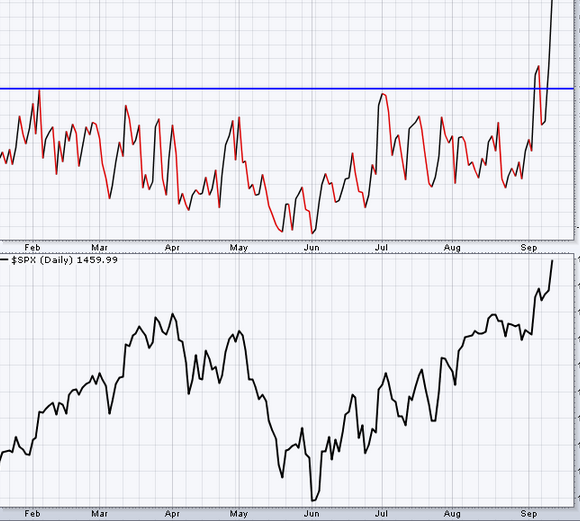
This chart is my working chart for the $SPX. (And it gets worked....) One of the most interesting windows of the indicators currently is the OBV. During the 2011-2012 rally, the OBV ramped up with the market. On the current rally, the OBV has been significantly muted... Read More
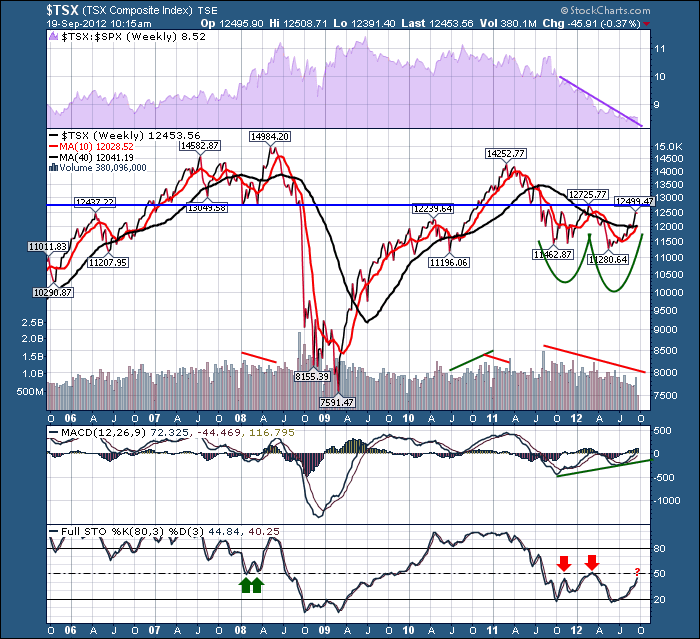
The Canadian Technician September 23, 2012 at 10:26 AM
My thinking is leading me in a particular direction here. Today is a particularly interesting time. Crude was at Horizontal resistance. It tested above and failed. The $TSX is at a horizontal resistance. We are awaiting the breakout. $GOLD is at horizontal resistance... Read More
The Canadian Technician September 22, 2012 at 10:32 AM
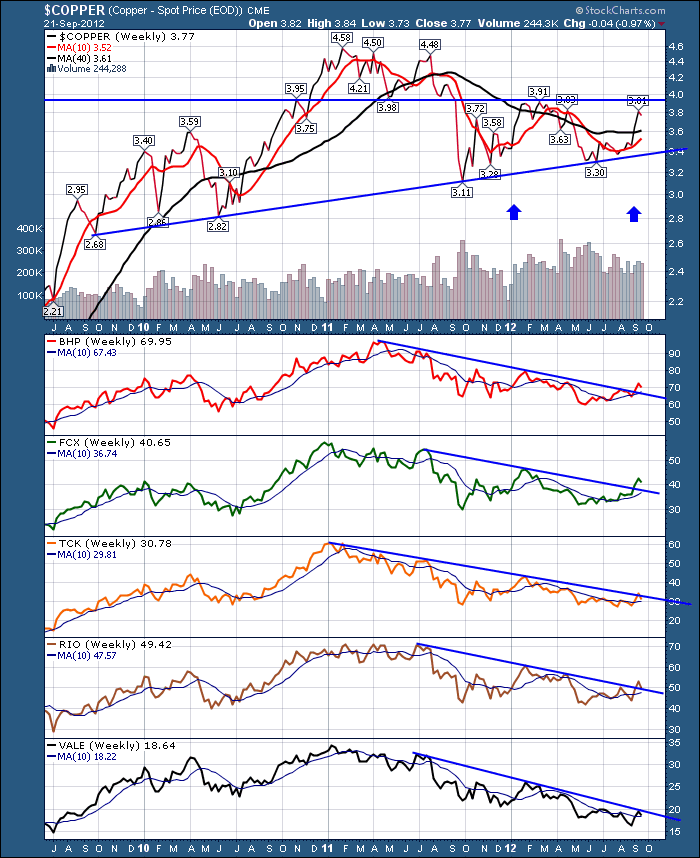
$Copper check out the chart. Copper is at a really interesting place this week. 3 of the 5 global miners have broken their respective downtrend lines. Sounds bullish!!! Well, not so fast. Normally, the miners would move before the metal or at least start to outperform the metal... Read More
The Canadian Technician September 19, 2012 at 01:35 PM
Sometimes we call it support/resistance lines. These lines are so interesting. To a non Technician, they would appear irrelevant. To the technician, they are the primary basic structure inside the toolbox. I don't need to convince anyone as to how important they are... Read More
The Canadian Technician September 18, 2012 at 04:01 AM
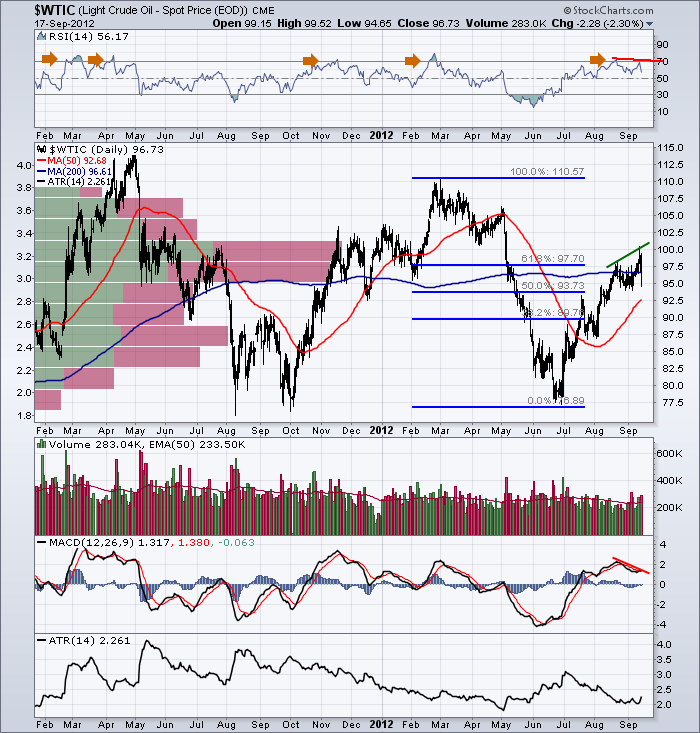
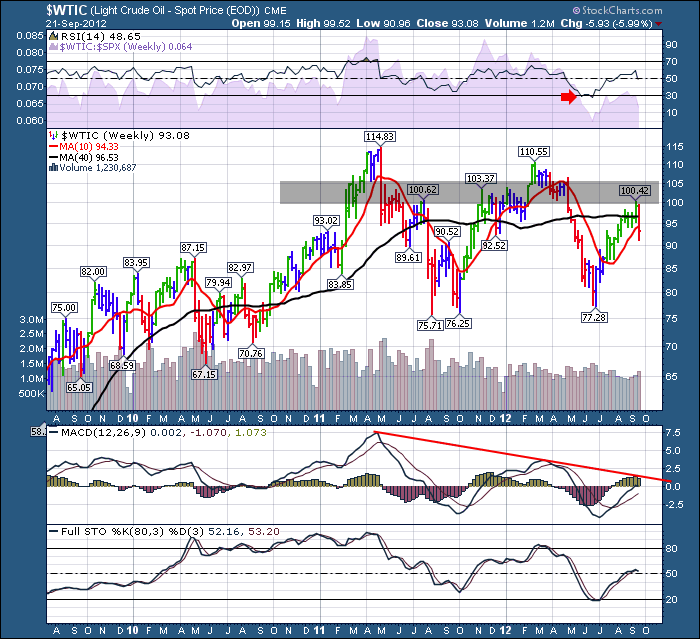
$WTIC had a rough 20 minutes today. I wrote about $WTIC a month ago, Read about it here. (august 23) A couple of problems that we discussed earlier. 1) When we used a PnF chart to talk about crude it had an upside target of $102... Read More
The Canadian Technician September 15, 2012 at 01:33 PM
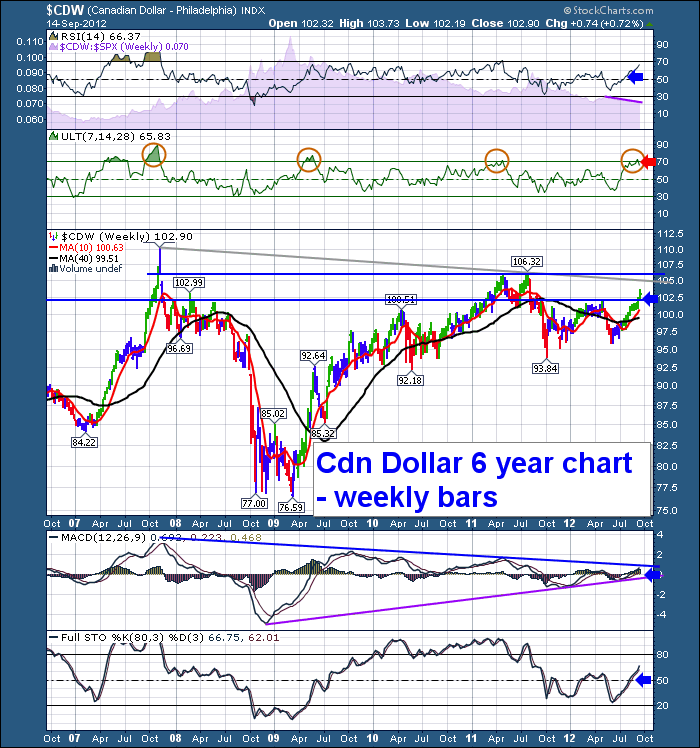
Canada is a Commodity currency. Interestingly, the Cdn Loonie has been on a tear for 3 months now. The Canadian toonie has followed oil higher, but the Canadian toonie chart is not really similar to the commodity we nickname Dr... Read More
The Canadian Technician September 14, 2012 at 05:33 AM
Sometimes, the market goes on a tear. Recently, it has moved up fast into what some would call overbought. Markets can stay overbought for a long time, so that is bullish not bearish. But a few indicators identify 'severely overbought'... Read More
The Canadian Technician September 12, 2012 at 01:34 PM
The Banff Conference was tremendous. Thanks to all who were able to make it. Back into the markets today after a very busy period... Read More
The Canadian Technician September 05, 2012 at 02:04 PM
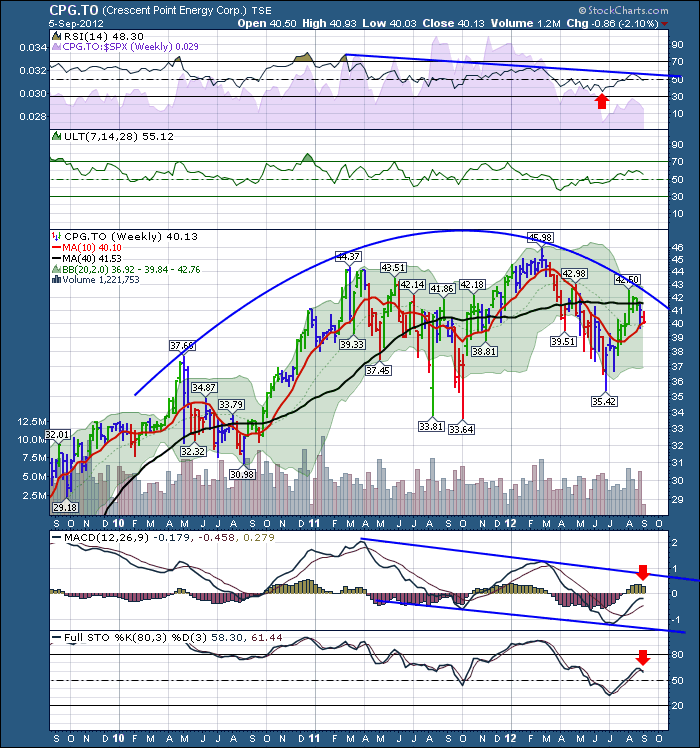
I pulled up Crescent Point Energy today. This arc looks like a moon path moving across the south sky. It can also be called a rounded top. Crescent Point has started to make lower highs on the weekly chart, but still has some higher lows... Read More