The Canadian Technician October 31, 2012 at 01:38 PM
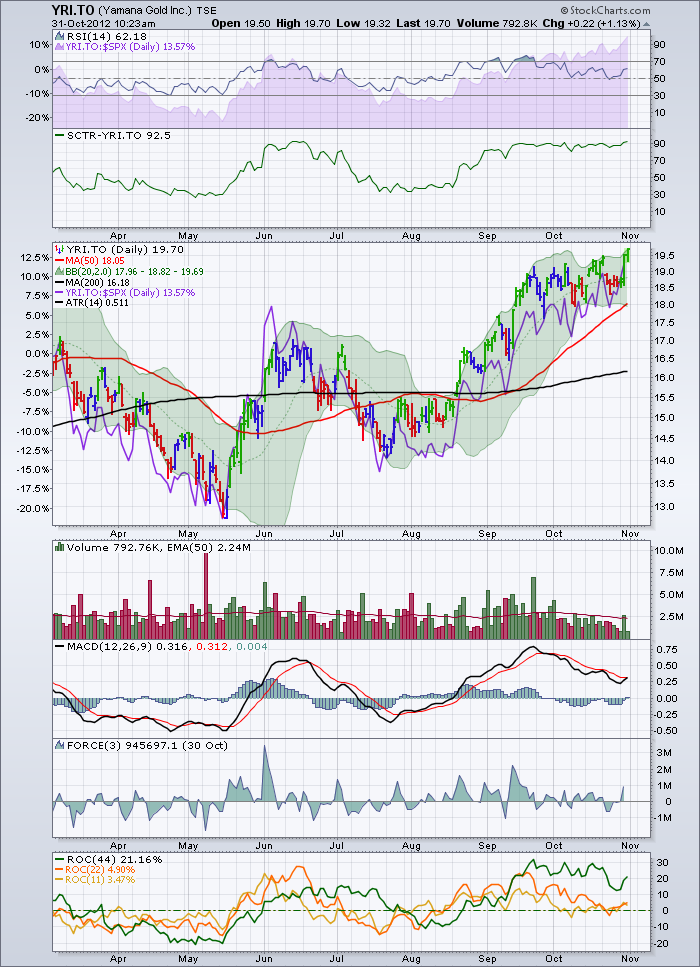
Some very interesting looking charts right now. Just following the stocks on the home page In the TSX box and the SCTR TSX box. Here is Yamana breaking out. [2012-02-17 6:19:02 PM] Greg: This message has been removed. Bombardier looking interesting... Read More
The Canadian Technician October 28, 2012 at 03:45 PM
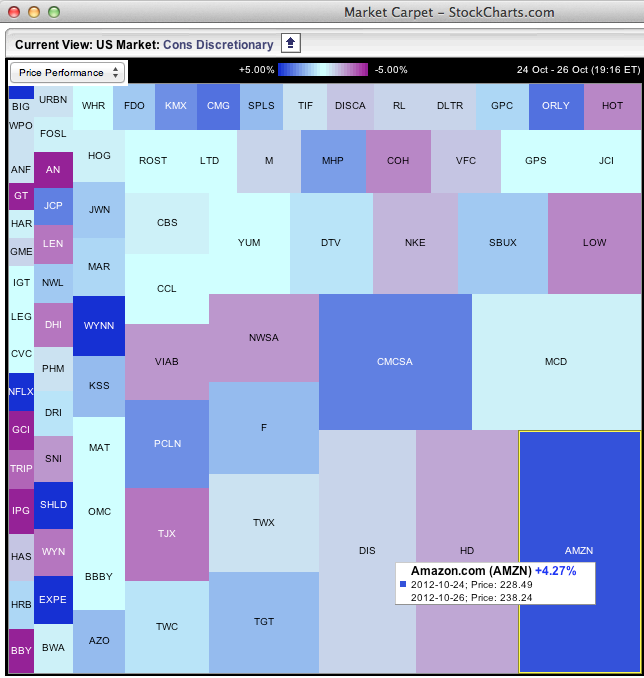
Amazon posts the worlds most remarkable resiliency with respect to its shareholders. One of AMZN'S claims to fame is it's remarkable P/E with earnings sliding for the last 2 years... Read More
The Canadian Technician October 28, 2012 at 02:59 PM
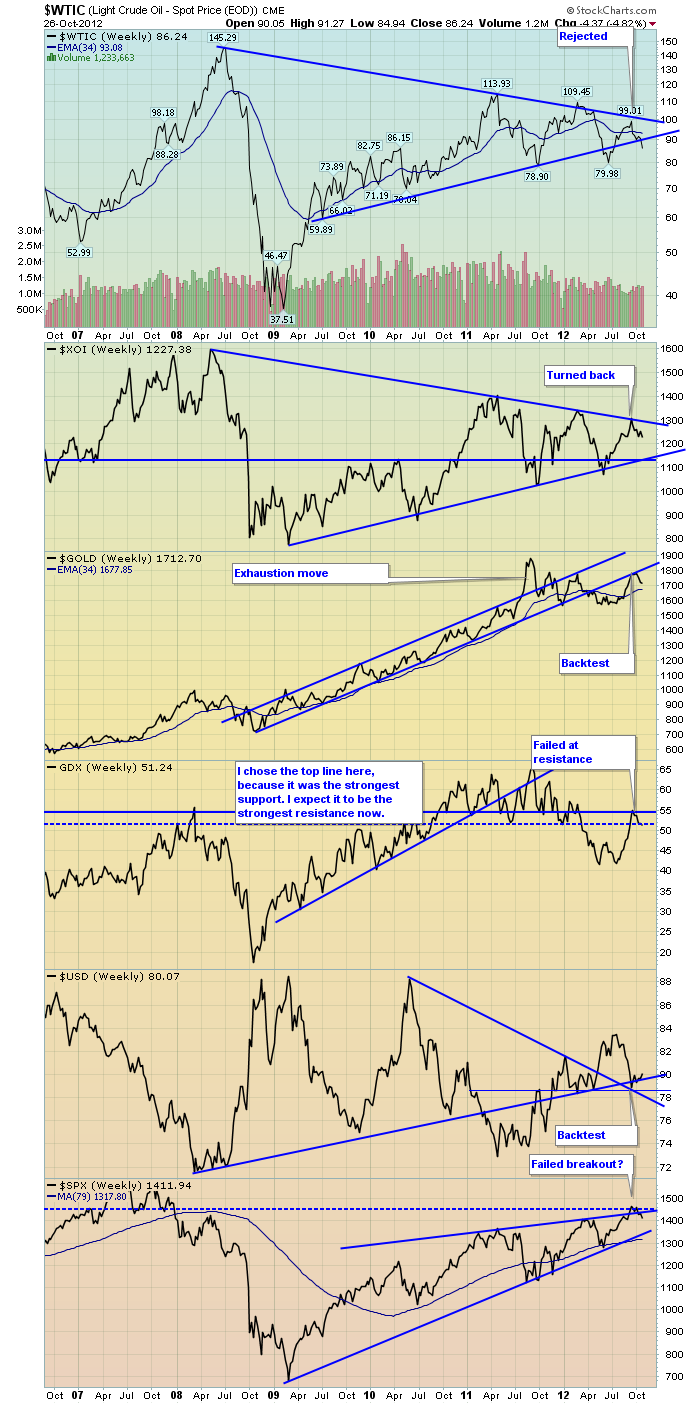
Just an update on the major pennants. Oil has broken out to the downside again. All the other charts have followed this move as the $USD has moved higher. This still looks to have ominous outcomes ahead... Read More
The Canadian Technician October 28, 2012 at 03:45 AM
Amazon posts the worlds most remarkable resiliency with respect to its shareholders. One of AMZN'S claims to fame is it's remarkable P/E with earnings sliding for the last 2 years... Read More
The Canadian Technician October 26, 2012 at 04:23 AM
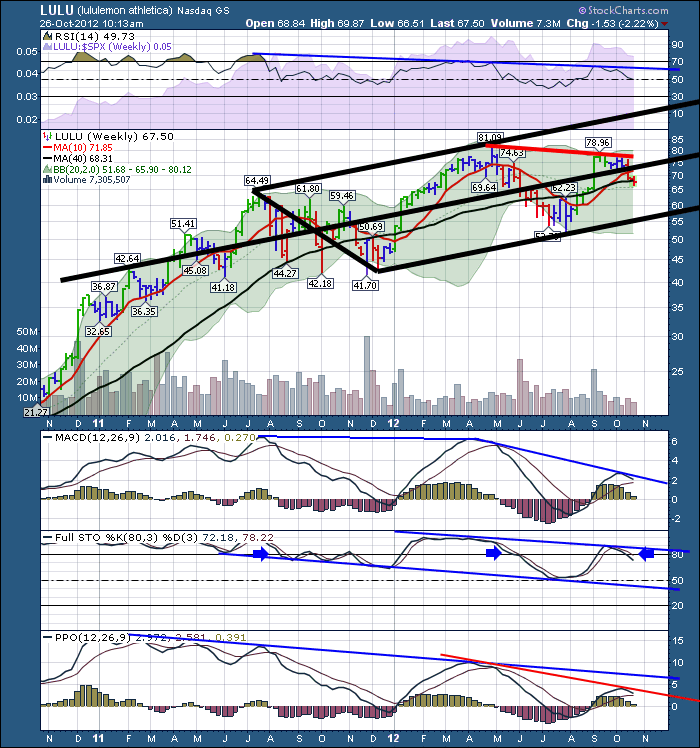
LULU can never be a lemon? With 2 young adult daughters and a wife, I see a lot of LULU apparel. In the recyclable bag cupboard, I think it is dominated by the LULU shopping bag. I even joked about LULU at the last monthly CSTA meeting in Calgary. Not a laugh from the crowd... Read More
The Canadian Technician October 23, 2012 at 10:58 AM
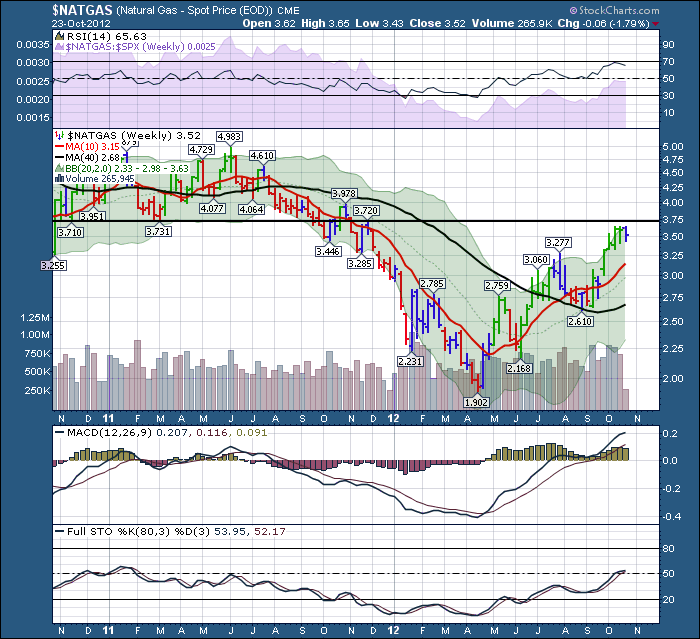
$NATGAS Just an update on $NATGAS. I've posted this chart many times, recently saying that $3.75 would be resistance. Well, we've spent 3 weeks trying to get through the level. We got a foot of snow in Calgary and it sure feels like winter... Read More
The Canadian Technician October 19, 2012 at 02:14 PM
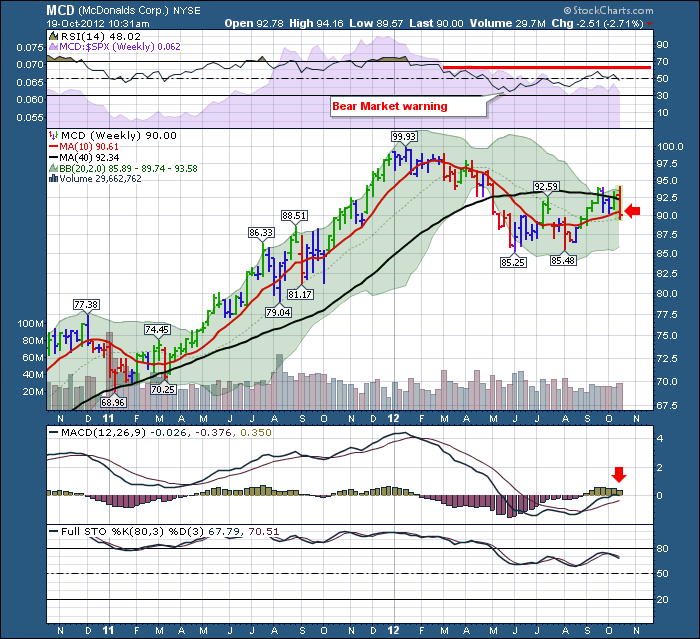
Recently, this earnings campaign has been 'better' than expected according to Bob Pisani's work on the floor. Steve Grasso, a floor trader was not as optimistic. Two opinions, that's what makes a market. A buyer of bargains, or the seller of a trending market trendline breakdown... Read More
The Canadian Technician October 19, 2012 at 06:24 AM
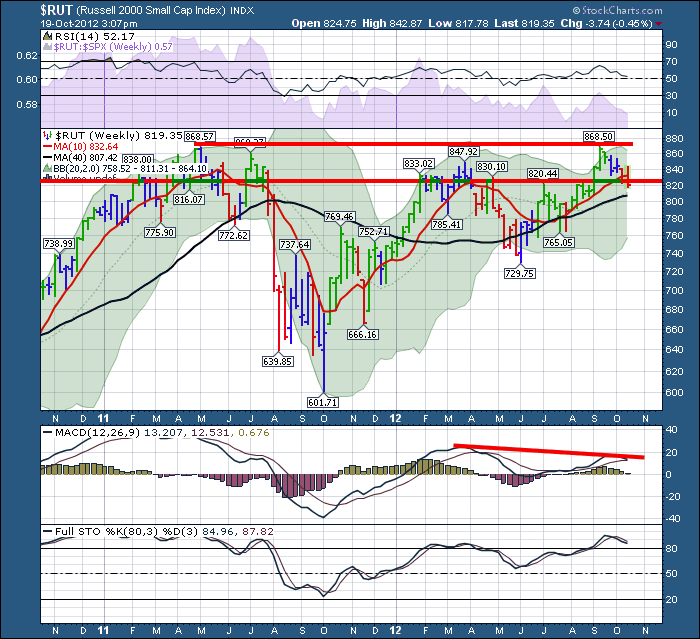
Just a quick note on a glaring double top. The $RUT got within $0.07 cents of its previous high back in May 2011. It has currently rolled over on the Sto's and the MACD. This currently looks like a big double top. Maybe its just a brief retest and pullback before going higher... Read More
The Canadian Technician October 18, 2012 at 02:46 PM
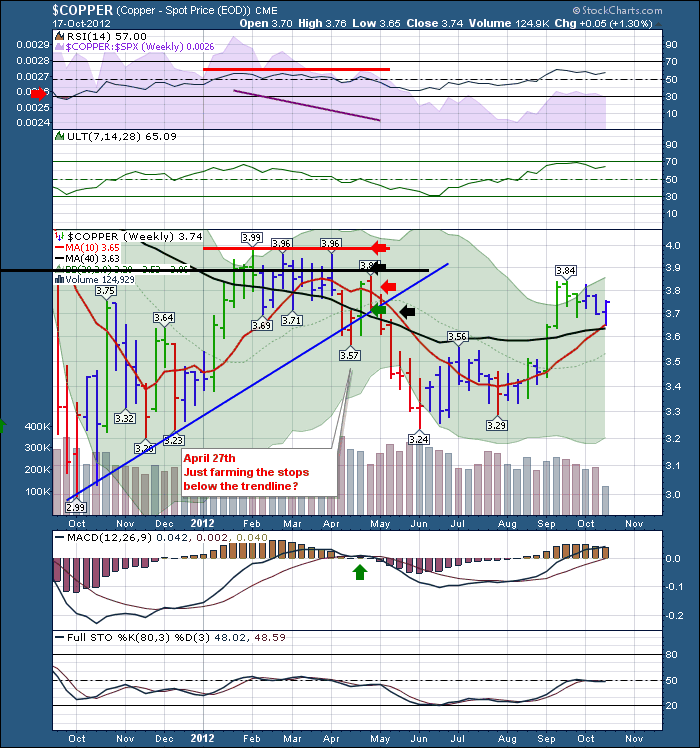
Copper found support at the 10 week and the 40 week line this week. Is this a bull flag? $HSI is moving higher above its 20 Month MA. India has pulled back recently but is clearly above the 20 month. Looking for a few more markets to get above... Read More
The Canadian Technician October 16, 2012 at 12:34 PM
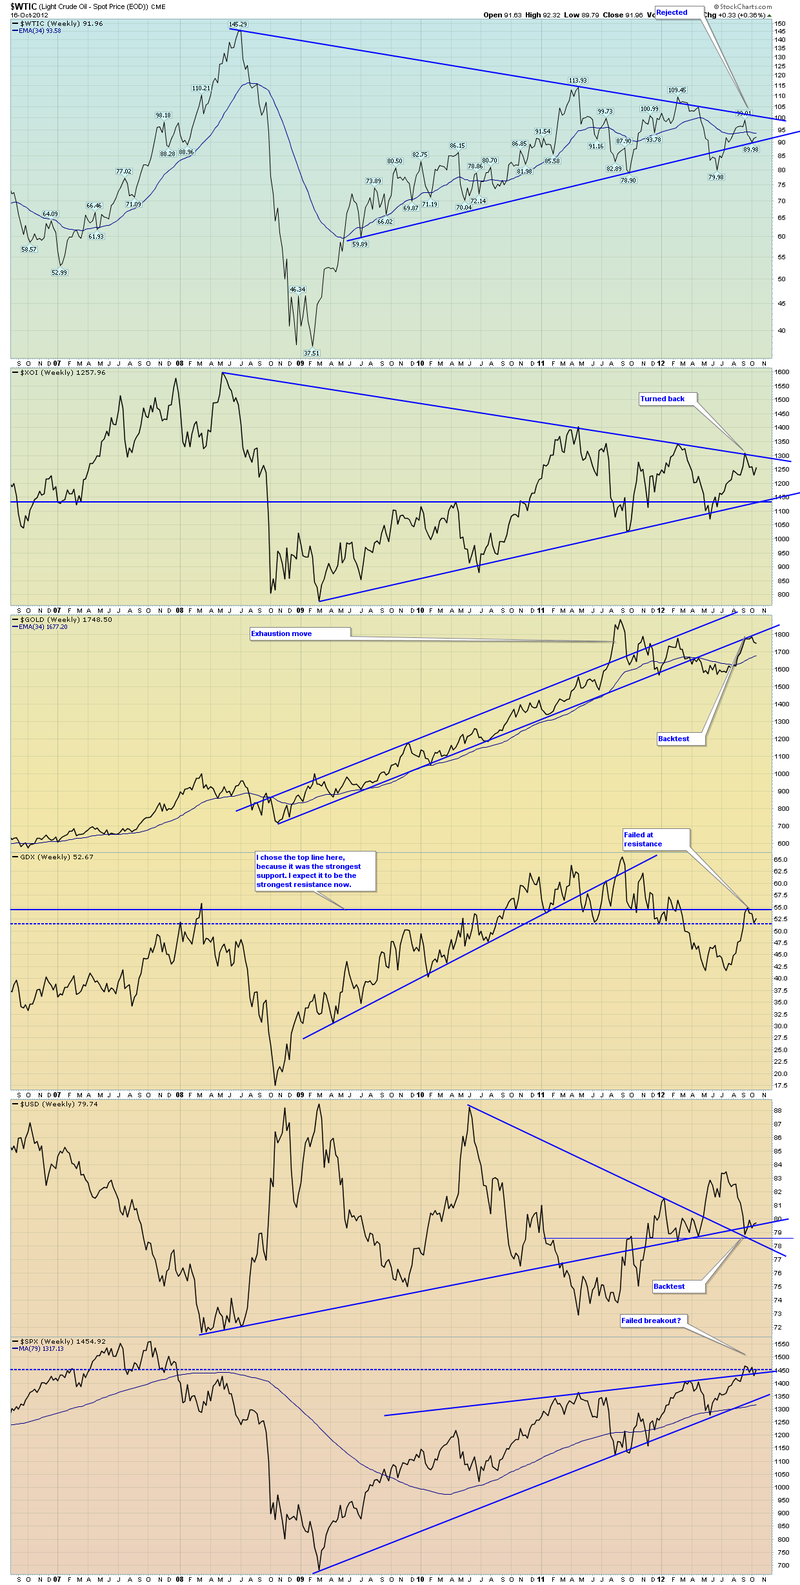
As we lead into the Options expiration Friday, the markets are getting a little bounce. Check out this set of weekly charts. Lets look at them in order . 1) This is a 5 year trendline in oil. What a massive pennant... Read More
The Canadian Technician October 15, 2012 at 09:32 AM
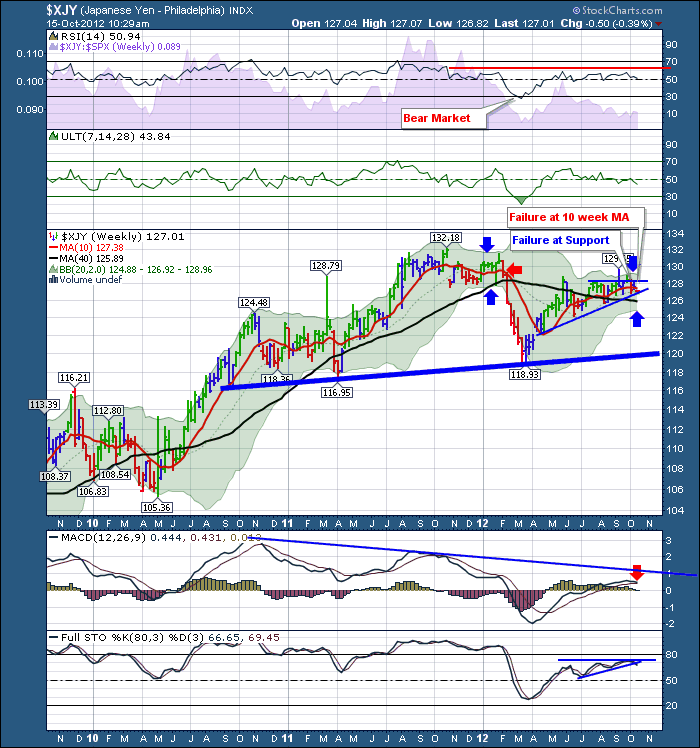
Dire Straits had some great albums. One of my favorites was Love Over Gold. Today the stock market took that literally and loved stocks in dire straits over gold. I don't have a long term bias one way or the other on gold. I just want to be on the right side of the trade... Read More
The Canadian Technician October 12, 2012 at 03:34 PM
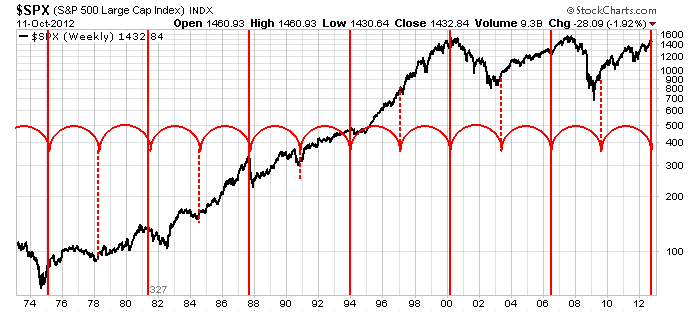
OK, So what makes this chart spooky? Well, it is an entirely different cycle than the blue cycle posted on Thursday. That's not spooky. There are 13 lines on this chart. 6 dotted, 7 solid. But that's not spooky. Keep in mind the scale is 30 years. The spacing is 327 weeks... Read More
The Canadian Technician October 12, 2012 at 07:15 AM
Here are two stocks. One above the other... Read More
The Canadian Technician October 11, 2012 at 02:37 PM
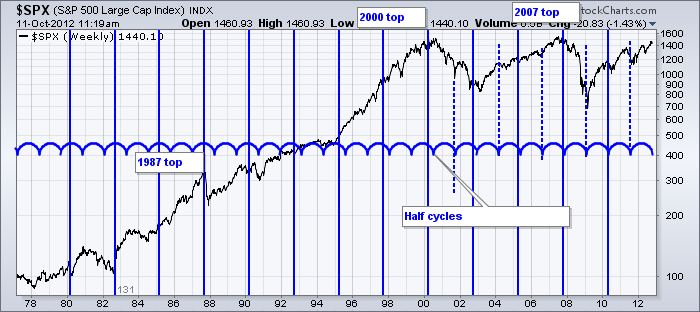
Here is an interesting 131 week cycle. This cycle seems to be pretty darn important. It has marked the top in 1987, 2000 and 2007. It has marked some major inflection points in other years. The 65.5 week half cycle seems just as important... Read More
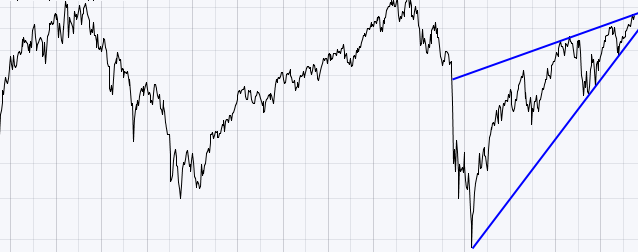
The Canadian Technician October 11, 2012 at 08:34 AM
The Canadian Stock channel (BNN) used to have a morning guy that had a great quote. "A five year old with ruler can do this!" So why is it so hard? Well, here's a chart the 5 year old would have done very well with... Read More
The Canadian Technician October 08, 2012 at 02:14 PM
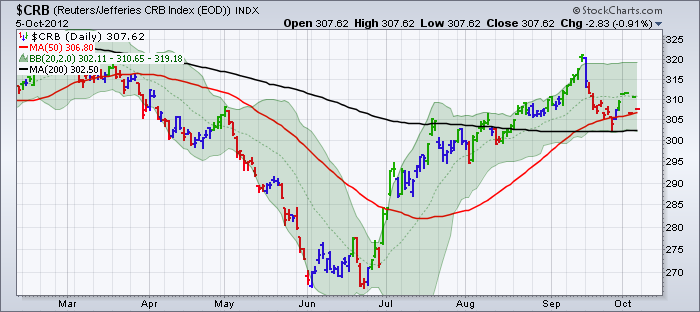
Just an update on the $CRB chart. You will still see the closing value of the CRB but the Intraday data will be lost. This is a change by ICE apparently... Read More
The Canadian Technician October 08, 2012 at 05:36 AM
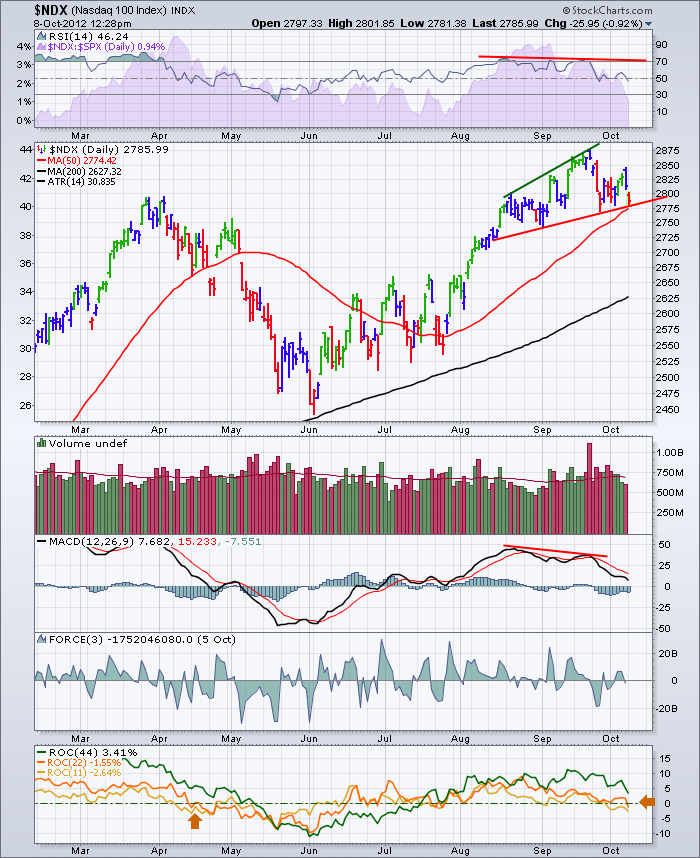
The last few weeks has been very difficult for the $NDX. Apple is a key part of that obviously. This is a real area of support that needs to show up here. We need to see the institutions step in and turn the big techs higher. The Negative divergence is starting to show its hand... Read More
The Canadian Technician October 07, 2012 at 06:20 AM
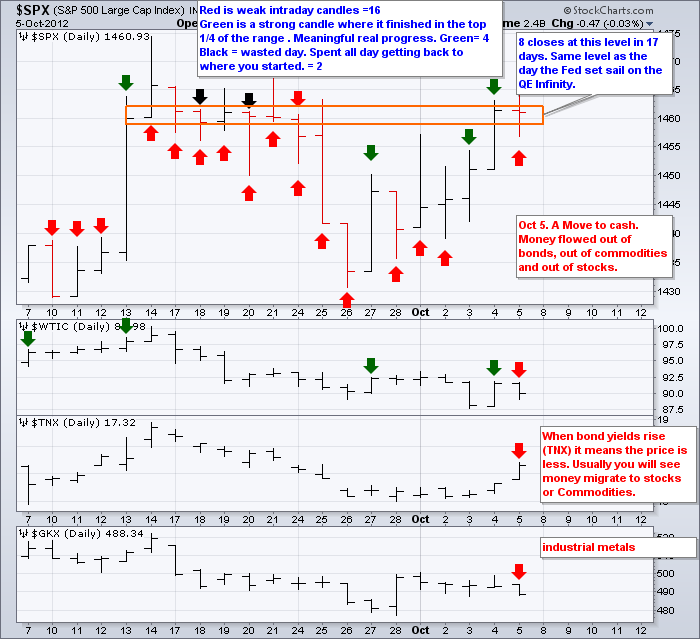
Sometimes, the market seems to need time to sort itself out. Check out this daily chart of the $SPX. Various clues over the years get added into an analysis. Investors Business Daily likes to look at where the market closes each week relative to the high low range for the week... Read More
The Canadian Technician October 04, 2012 at 04:04 AM

I want to talk about using PnF today. Point and Figure (PnF charts) can be found at the bottom of your regular charts. There is a hyperlink to take you to the PnF chart... Read More
The Canadian Technician October 03, 2012 at 05:14 AM
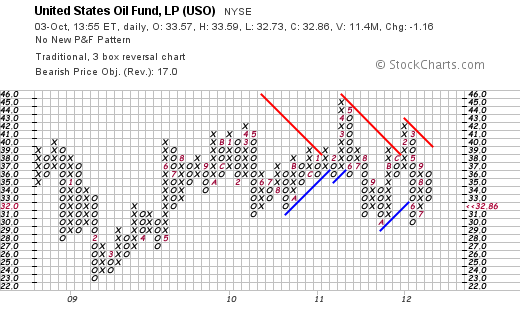
Today's chart is best demonstrated through PnF. I recently remarked that the $10 drop in oil suddenly was a bad omen. Usually when there is no reason that is a bigger problem. Well, today oil is letting go but the TSX Oil and Gas stocks are holding in line or only down 1... Read More
The Canadian Technician October 02, 2012 at 06:35 AM
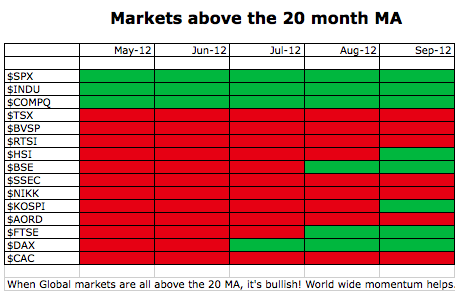
Here is my Global markets summary in just one slide.The table is demonstrating how the world markets are shifting from below the 20 month MA to above the 20 month MA. If you look at the $TSX chart farther down you can see why this is important... Read More