The next few days my blogs are all about currencies.
The Yen has snapped. That is not news. Let's review how it broke down.
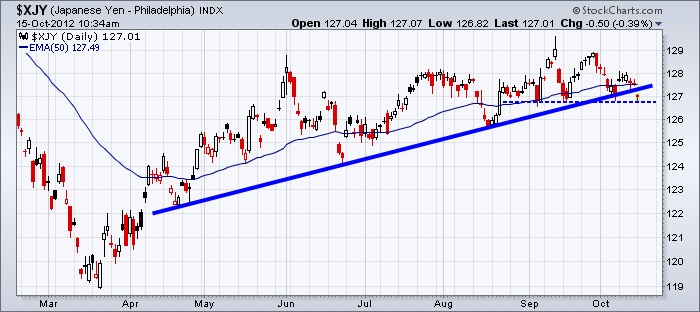
In October I wrote about the Yen and the bearish setup. This was the blog link for review.
This was the chart at the time.
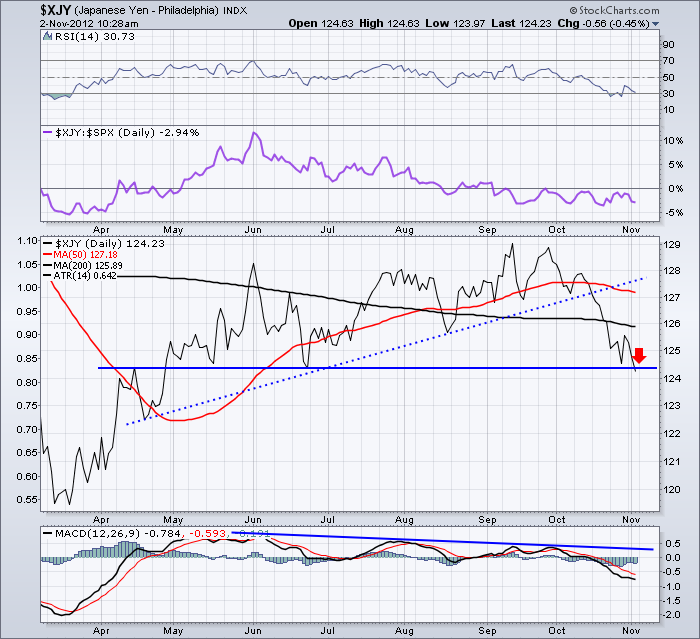
A few weeks later I followed it up with another blog about all the $USD Index currencies.
For those who like to review Currencies Blog
Look at the progression of the slide. I suggested it probably wouldn't be a straight line to the bottom.
Here was the description.
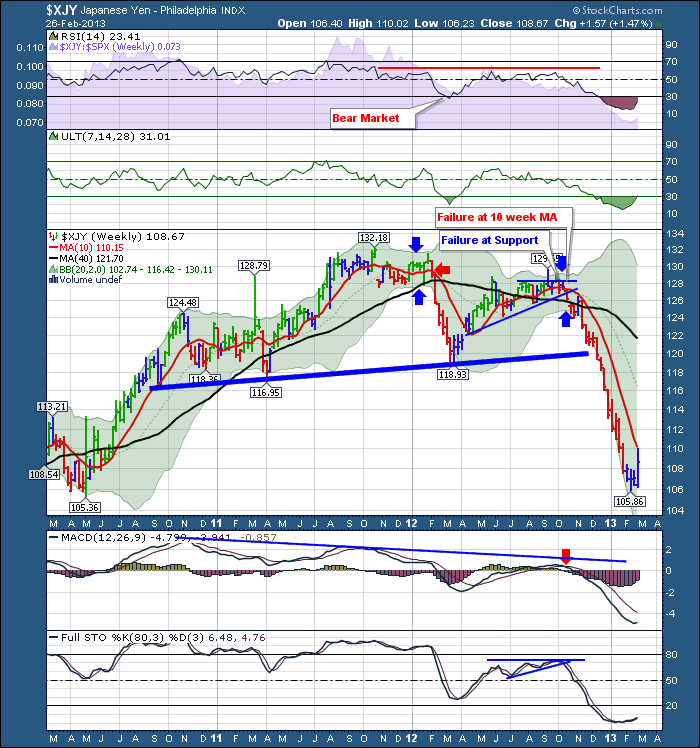
"That has been massive divergence that finally released. We had noted the Head/Shoulders pattern on the Yen before it broke down. The inside of the right shoulder of the 2 year H/S pattern was marked by the dotted line. Check a three year chart. The neckline is around 120. If the neck line does not hold, this is a big change. The long term Yen target would be closer to 111. To repeat, that would be after a lot of oscillating. I do not expect a straight line down. But I feel like we could drop quickly to 120."
Well, here is the Yen today.
Needless to say, I got the direction right, but what a move. Way faster than I expected.
Ok.
So why the chat about the Yen?
Charts can always break one of three ways. Up, Flat or Down. The purpose of TA is to improve the probabilities based on historical examples. At least it is important to understand when you could be like Wiley E. Coyote standing over the cliff looking down when the anvil is coming back up to take off your face.
So here is my Wiley E. Coyote pose today.
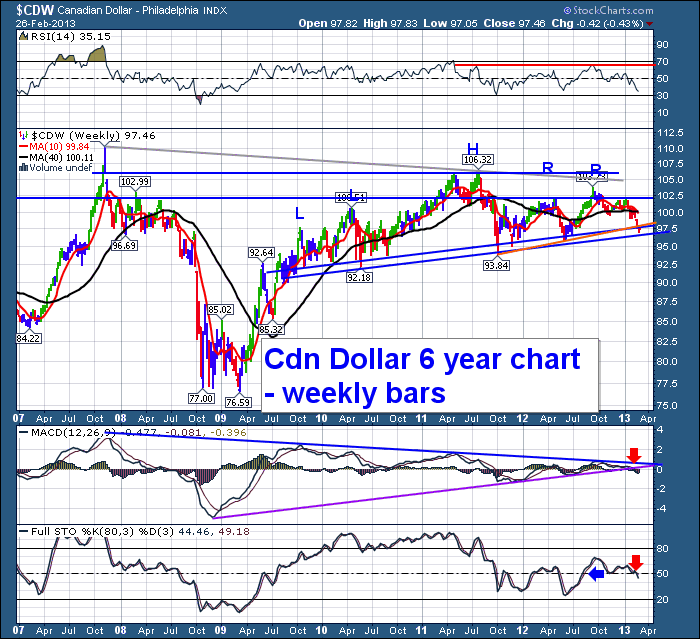
Let's start at the RSI.
First of all. Its in a bear market. The RSI sat down on the 30 level, and has been unable to bounce above 65. That is a problem.
Looking at the price bars.
The $CDW is building a gigantic H/S Top. Sometimes it is referred to as an irregular top when it has 2 left shoulders and 2 right shoulders. This chart has the potential to fall to 86 cents. I know. That seems crazy. Yeah, well crazy showed up on the $XJY chart above.
The line on the chart starting at the top in gray is the trendline off the 2008 peak. The 2 horizontal blue lines have been support / resistance for the canuck buck for 7 years. The 2 upsloping blue lines represent support. The top blue line has more touches which makes it more valuable, but you can see it has three violations and now the 4th. So maybe it should just be the bottom line.
If the Canadian coin can find some support here we are off to the upside races. That would be the anvil in my face. I actually expect it to fall. Look at the MACD. It has now broken out of the 4 year pennant and is breaking down. Not only out of the pennant but below zero. It would have to reverse real soon to help me believe this was not happening.
Look at the full sto's falling below 50. This seems to be such a major point on the sto's. When the sto's fall below 50, it is real bearish...
OK. So the Twoon the loon appears to be singing is lower. It recently lost the support of the 10 WMA and the 40 WMA. If you are long energy and or the $TSX and this falls like it looks like its going to fall, you may wish to add protection sooner than later.
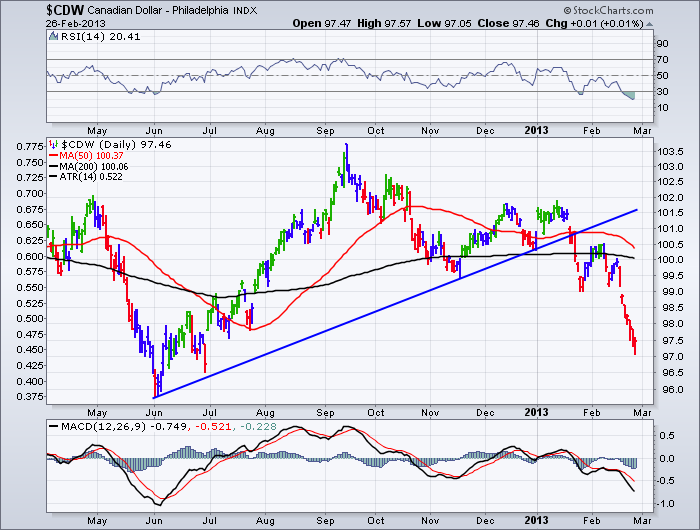
Here is the Daily.
Obviously, this is not good for Edmonton, Alberta. Its not good for Calgary, Alberta either. It is certainly not good for Provincial and federal budgets. It might help export sales but it will hurt domestic sales. This also affects mining.
Who knows if the anvil will hit me in the face ( the Candian dollar rises), but so far, I think the roadrunner comes into the scene and pushes the Loonie Toons off the cliff.
That's all folks!
Good Trading,
Greg Schnell, CMT

