Lululemon (LULU) has been a great Canadian success story. Today we'll answer the question "Is It Still A Success Story?"
Going back and looking through my old blog on the stock, here is a link to follow the history of LULU since I blogged about it on October 25, 2012.
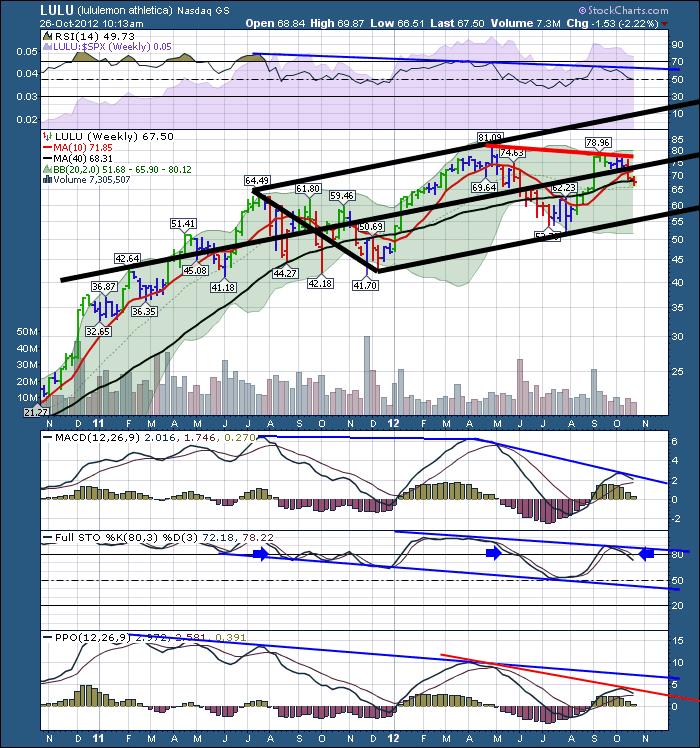
Lululemon October 25, 2012 - In Love with a LULU or in love with a Lemon?
Let's post a current chart in Lululemon colours. Now we have the beauty of hindsight.The optimal place to sell Lululemon with hindsight was the brief spurt to new highs that ended up being a failed double top a year ago in June 2013.
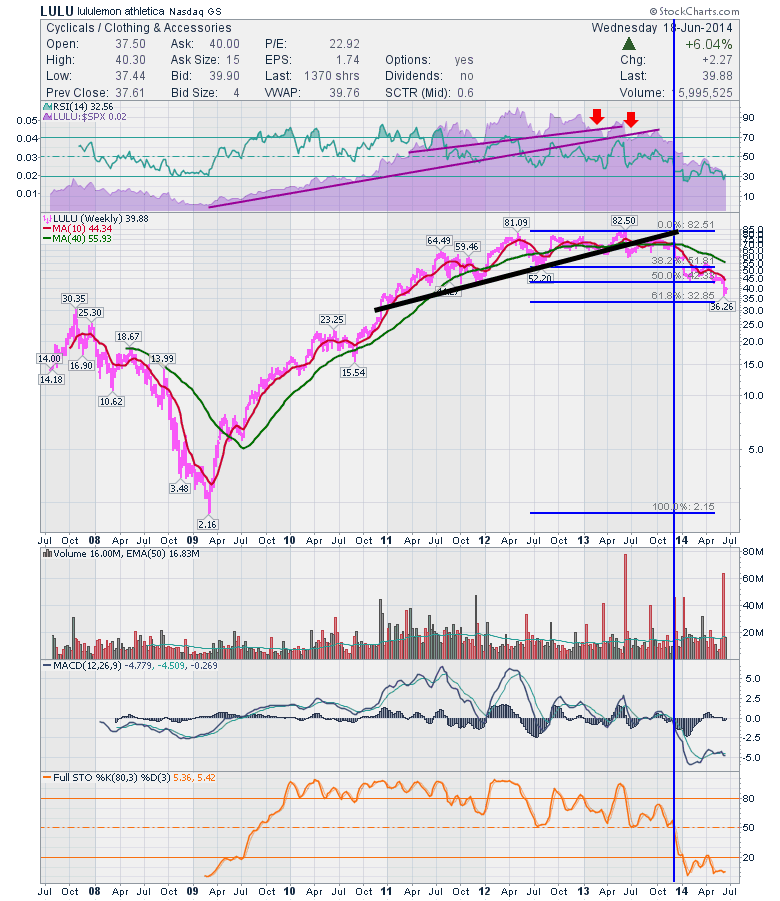
The SPURS line was broken in June 2013. You could also see a shorter SPURS line that would have kicked you out in the first quarter of 2013. With either the first red arrow or the second, the relative strength was making lower highs and lower lows before and immediately after the final peak.
The next is that the RSI was still positive but it fell below 40 in December 2013. That was too late! The continuous falling/testing below the 40 WMA showed some clear weakness. The failed double top at 82.50 also broke the thick black trend line immediately after the test of the high.. How many bullets can a chart take?
Now the stock is 60% off the highs. Is it a bargain? I expect a series of bear market rallies, but investors are fighting the trend till management changes something dramatic. My daughter was recently in London England and the store was empty every time they walked by. This chart tells you that.
Just to finish a review of the chart indicators, the MACD made a tiny high in October 2013 and rolled over into negative territory on a weekly chart. When the MACD failed just above the zero line, it is a very important place to be cautious. Shortly after, the Full Stochastics with a long period setting fell below 50. It now resides under 20. The blue line suggests the collapse of positive optimism.
Will the stock bounce? Probably. But you are now investing against the trend.
I went into the Lululemon store yesterday in Calgary and it was almost empty. I went into the Apple store and it was swarming with people. Both of these retailers still have momentum. It might just be in opposite directions
Here was the chart from my 2012 blog. It doesn't always work out clearly, but investors had some clues to be looking for an exit within the sideways movement before the rollover finalized. The fact investors got another shot at the all time high was probably remarkable considering the product line didn't change much. I think it was a plan for international stores and mens wear that got it another push. Usually it takes a new product or some dramatic change in success to change the trajectory of the stock. In this case, investors didn't see what they wanted to. They also had the too-thin-to-wear problem. The CEO comments. The Management change.
Hopefully this analysis of how the chart was breaking down long ago is more powerful by putting it in todays context. I wish Lululemon management all the success they can get. The investor is currently telling them something dramatic has to happen. When I went into the store yesterday, it looked like same old, same old. The chart tells us that as well. This is how retailers stocks fall from grace. Hindsight is 20/20, but LULU was at a make-or-break stage in the stock trend and they failed to break out to the upside. Now management will have to do something remarkable or be absorbed by acquisition to change the trajectory. While they still have cash flow and ok sales, the trend is not strong enough for the hyper world of whats-in-vogue retailing.
In the top chart, in the full quote box, the SCTR ranking is 0.6 ; that means 99.4% of the mid cap stocks are behaving better than this current lemon. Ouch!
Good trading,
Greg Schnell, CMT
