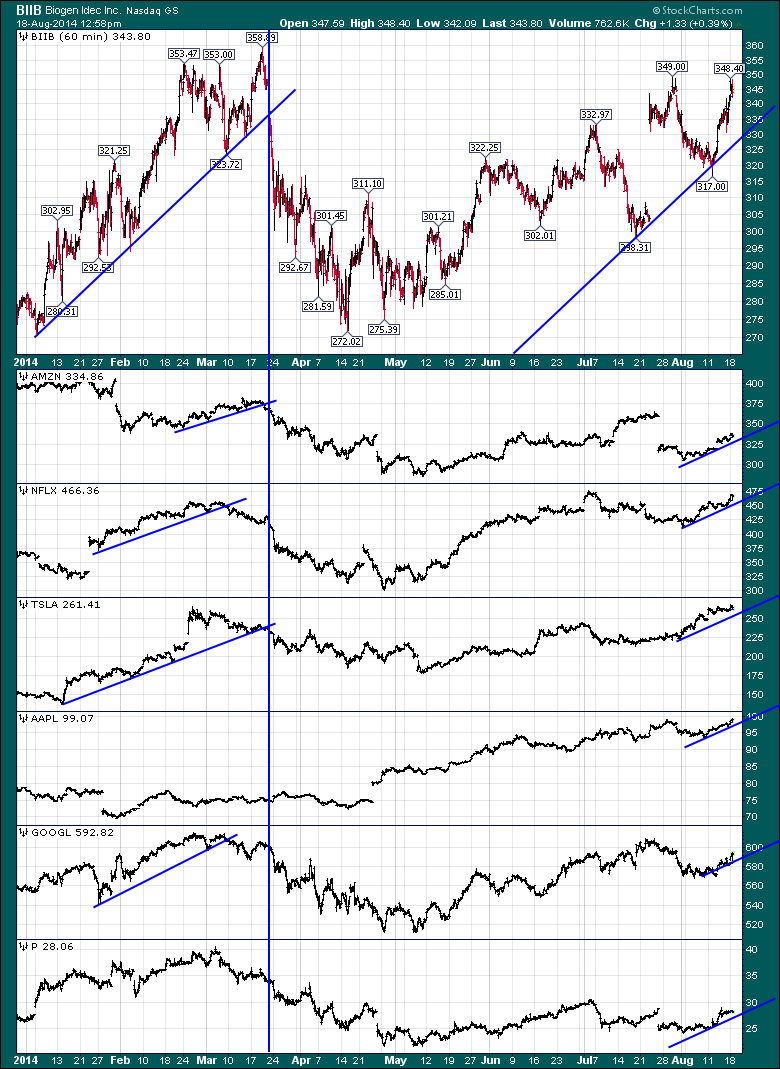
Back in March, all the high momentum stocks sold off meaningfully and there was a great debate about why on the financial media sites. Let's discuss why the momentum of these stocks becomes more important than the price/earnings at a given point in time. You may recall the Biotechs going for a huge dive. Notice all of the other high momentum stocks had broken their trend lines in the weeks before.
At the time, AAPL was still unloved until the April earnings breakout. Pandora was still trending higher. Now the two are opposite. Pandora looks unloved and AAPL is making new all time highs. I want to discuss market correlation and what could be better than a 5 minute chart. Let's look at a slightly different group of stocks on an intraday basis from todays trading. They all are considered high interest, high momentum stocks currently.
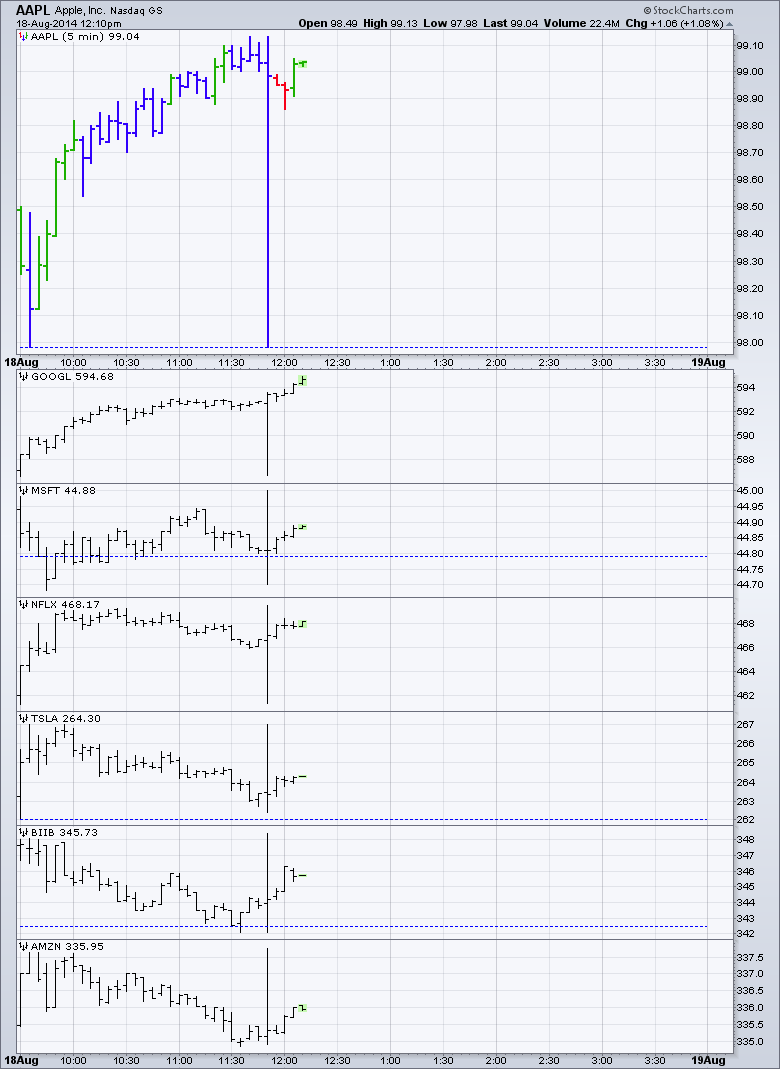
Now this is an intraday 5 minute chart, but looking at the chart patterns won't tell you which one is a huge biotech. There is also a media content stock, a broad line retailer, computer hardware, software and search.
What is more interesting, GOOGL and AAPL surged down, TSLA, BIIB and AMZN surged up? All in 5 minutes, GOOGL went down and up $7 in 5 minutes. The other stocks all made outsized moves in 5 minutes. What was more interesting, is every stock tested the intra day high and the intra day low to the left of the large trading candle on each chart, all in the same 5 minutes. This high correlation of stocks by computer trading models, actually helps us because it builds strong trends that we can use to help us. If you trade intraday, its a nightmare. That tells me that the cycles moving the stocks are closely correlated, repeatedly testing for strength. I don't have an answer for who is big enough to move Google $7 down and back in a few minutes, but it wasn't me! If you trade high momentum stocks, it is critical that you establish groups for your stocks that trade similarly. If they all start to break down, you'll be more aware. As an example HPQ is Apple's peer in hardware, but there is no spike in HPQ today. Comparing Apple to HPQ would have little informational value.
Lets talk about methods to compare stocks to other stocks. This does not help minute by minute, but trends do show up over time.
By plotting the S&P 500 ($SPX) relative strength, you can start to see divergences especially on high momentum stocks. Let me clarify what all this "Relative Strength' means. For each candle, the stock you are looking at will be compared to something, in this case compared to the S&P 500 on a percentage move. So if the S&P 500 is rising, is this stock -rising faster than- the S&P 500? This - rising faster than - phrase is where we use "Relative Strength". This tells us how it is performing 'relative' to something else. So the S&P 500 moves up 1% on a daily chart, does the stock move up 1.1% to 'outperform' the $SPX? We can do that on a 60 minute chart as well. Now we can compare any symbol against anything we want. We can compare against the industry group, we can compare against the sector the stock belongs to, or we can compare to the bond market as an example. I like to abbreviate the S&P 500 Relative Strength as SPURS, just so readers understand what I am comparing to and I usually plot it in purple. It sounds so technical, writing it out long hand every time. Now lets plot that comparison behind the stock price moves. I have reduced the chart to 5 ticker symbols as a StockCharts Pro account can use 10 price components per chart and I need 5 for the relative strength application. So here are 5 stocks, with their SPURS on a 60 minute chart.
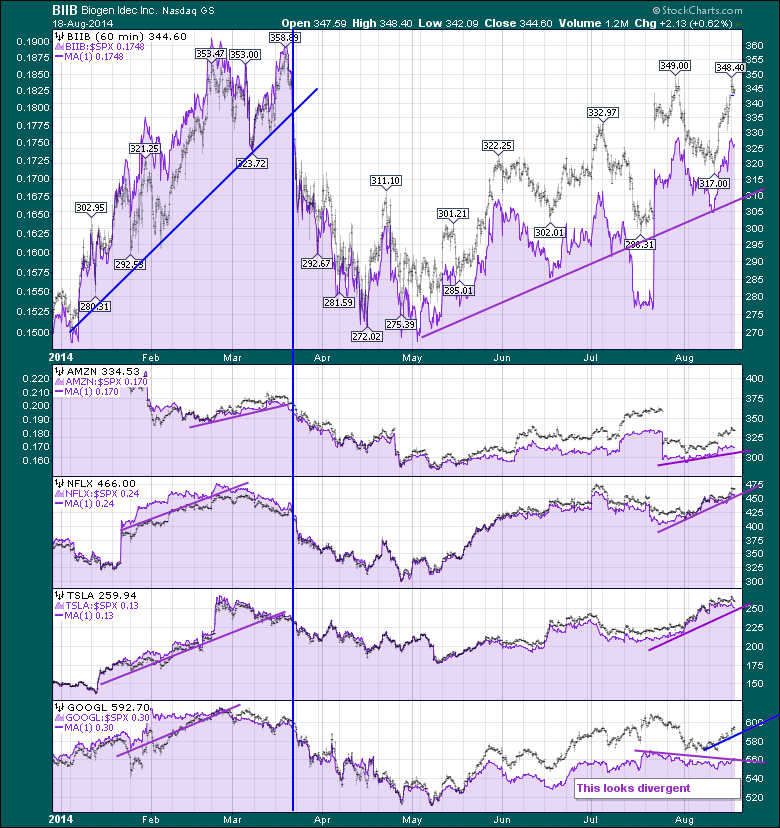
Chart 3.
This is important to understand. You can not use the scale of Relative Strength and expect it to track the price of the stock. They are on different scales. Please don't look at the gap between the price of the stock and the SPURS shown in purple. If I change the start date of the chart, I change the width of the area between the two lines. You can look for directional divergences. NFLX and GOOGL had the SPURS break down before the stock topped. AMZN did too, but its hard to see. When you see a stock like GOOGL in the bottom plot under performing the index in general for the last month, the institutional investors that hold GOOGL stock will be under performing the $SPX so they are less likely to add to their positions if they expect to outperform the index. This is especially true in high momentum names where there are no earnings like AMZN and TSLA. You will notice that for the first two weeks of August, GOOGL is performing flat with the S&P 500. If you invested in the other stocks, the purple SPURS area is rising, so the stocks are 'outperforming' the index. For an institution trying to outperform the $SPX, they need to get more weight into their best performing stocks. When this group starts to under perform like they did in March, you notice most of them continued to under perform until May. The odds of an institution using a 60 minute chart is low. They are more likely to use a weekly chart. Relative strength can be done on all time intervals depending on your trading interval. So when you scan Chart 3 even though it is a 60 minute chart, which stock has under performed the rest of the stocks on this list over a 4 month period? AMZN looks average at best compared to the $SPX just by looking at the purple area.
All that to say, these stocks are closely correlated in movements as the intraday 5 minute chart shows. When we expand that to 60 minute, daily and weekly, a trend change starts to emerge. All of the 5 minute moves shown in Chart 2 would have tried to take out protective stops under the price for people going long or above for people short the market within the days trading range. Yes, every one of the moves at the same time was hunting for intraday stops. When these stocks all start to under perform the index, the price earnings story doesn't matter much. Down they go as a group. So, if you are invested in the greatest stock in the greatest sector (BIIB as an example), a clue to the potential demise in your profits might be found by monitoring the relative strength in your 'sister' stocks. The SPURS is one method, The Industry Relative Strength is another, the Sector Relative Strength is another.
What IF there was an easy way to plot these in your default chart style?
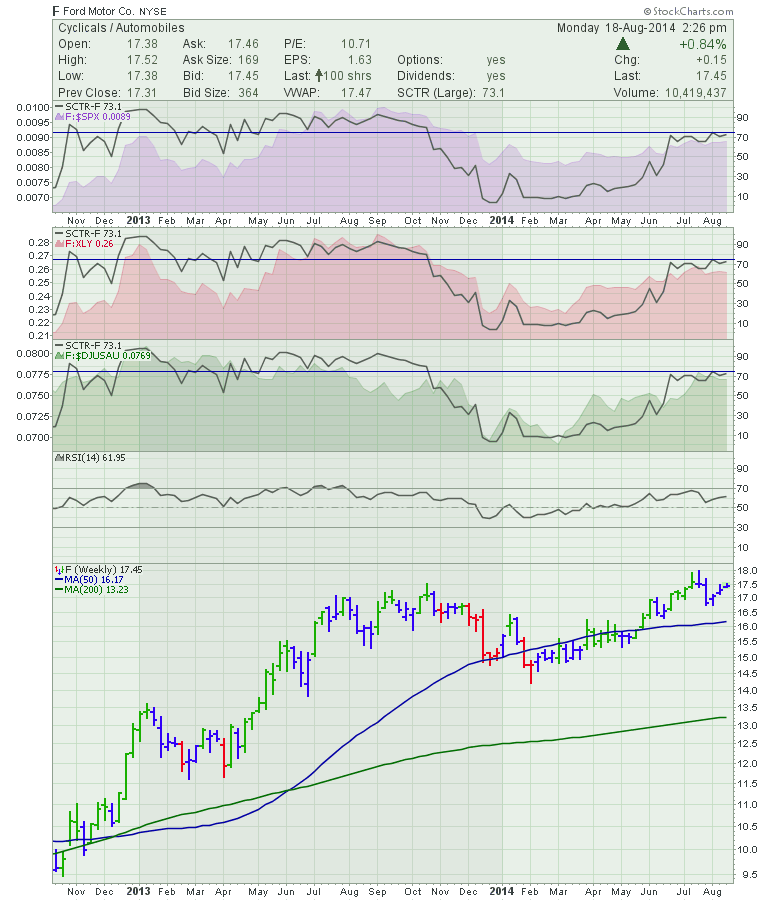
Check out this chart below without scrolling down far enough to see the price. At the top in purple is my SPURS. Next is a 'sector' Relative Strength in red, which for Ford is XLY. The third plot shows Ford compared to the US Auto Industry ($DJUSAU). This blog is long, but lets quickly look at two powerful messages from these three area charts plotted behind the SCTR. Notice in January 2013, the first two area charts dropped but the third shows F performing the same as the rest of the autos. That means the auto group went lower than the $SPX and the XLY sector, but F performed the same as the industry. Notice how the SCTR started to weaken at the same time. Look what happened in March 2014. The down sloping trend on all three area graphs was broken. This was partially due to GM in the news. Ford started to outperform the $SPX, it outperformed the Consumer Cyclical Sector (XLY), and the Autos group. The price of the stock rose. We can see the SCTR line starting to rise as well. So this works pretty well to help see when stocks are gaining strength. How about breaking down? The SCTR and the Relative Strength charts all started to break down at the same time back in October 2013. Ford started to under perform compared to the $SPX - SPURS, but also under perform the sector (XLY) and was under performing the industry for a while. The SCTR was confirming the damage about to be done. Look how timely the signals are as a group are when you scroll down to price. You'll notice the RSI had no idea what was in store.
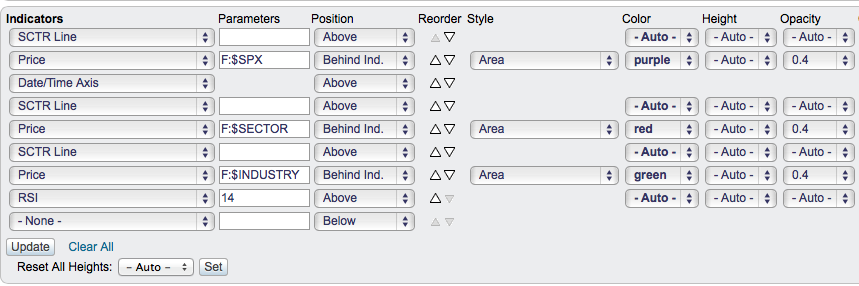
In this world of relative strength, being more aware of the stock relative to its peers can give some of the best signals. When you trade momentum stocks that get computer traded intra day and a $7 surge and reversal comes through in 5 minutes, stops are hit. The value of putting this all together into a chart or a group of charts can help you with timing your entries and exits. It can also help you with adding protection or using options to take advantage of trend changes. It won't help on 5 minutes surges though. Because the markets have more computer trading, it makes it more valuable to watch a wider array than your particular industry. You can click on any of the charts above to see the settings, but this is a snapshot of how I set it up.
The jungle of relative strength investing. Hopefully this clarified it all. If not, send me some notes on what is confusing about it. Thanks for reading. The volatility of these stocks are correlated right down to a 5 minute candle, but over time, some trends start to appear. Hopefully this article helps you understand the power of using relative strength and when relative strength starts to break down as a group. For an industry group or a group of momentum stocks that you might be invested in, these different RS indicators can help you.
If you liked this article, feel free to forward it to investing friends and family. If you didn't like the blog, please send me a note on what I could do better. The charts are printable and should also be clickable so that you can go look at the settings.
We try to keep our articles informative and entertaining. Make sure you check out the other blog writer articles in Mailbag, Chartwatchers, Traders Journal, DecisonPoint, Don't Ignore This Chart, Chip Anderson, Scanning Technically, and The Canadian Technician. Subscribers have access to blog articles by Arthur Hill, John Murphy, Martin Pring as well as the DecisionPoint Tracker and DecisonPoint Reports. Most blogs have a subscribe option for email or RSS feed. If you are paying for market commentary elsewhere, make sure you are reading all the value add from some of the best technicians who write at StockCharts. On the Blogs tab, there is also a Top Advisors Corner on the right side panel. Some great technicians post samples of their work there. This is free for everyone.
Good trading,
Greg Schnell, CMT
