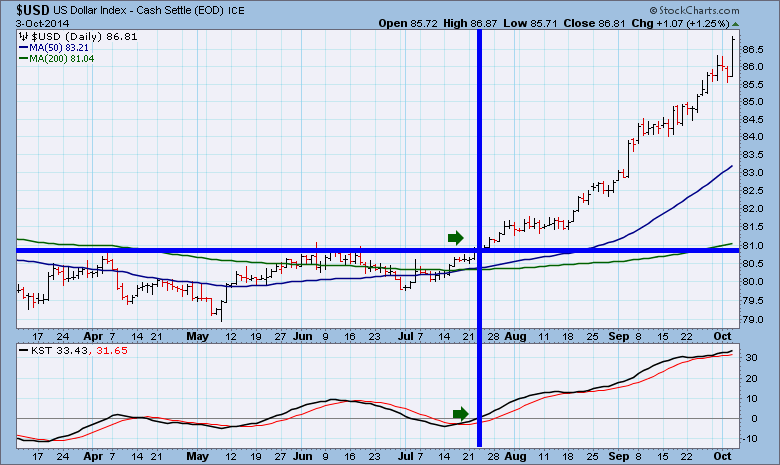
In July, one of the biggest currency moves started and dominated inter-market relationships. When the $USD broke out, a lot of major changes happened in the market. As an example, all of the commodities have been crushed and have broken through major long term trend lines.
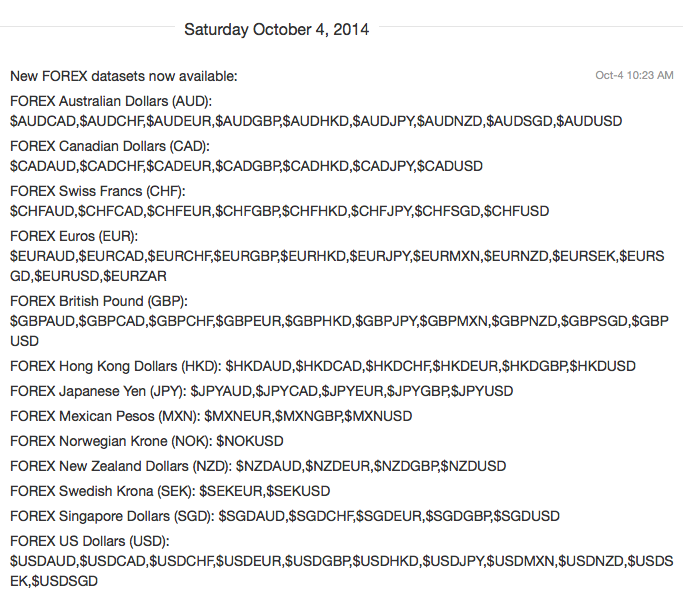
Well, today, StockCharts.com will be carrying many of the major currency pairs. This will be very important in helping us assess changing market conditions. Here is a list of the new pairs.
For equity traders around the world, this is a new tool for being aware of major changes in underlying conditions that may help spot meaningful breakouts / breakdowns in equities in specific countries. The recent break out in the $USD was widely covered by the blog writers at StockCharts. We know since then that the commodities have been pushed substantially lower. When a country currency really starts to change across all the forex pairs, the information can be leading edge that something larger is changing.
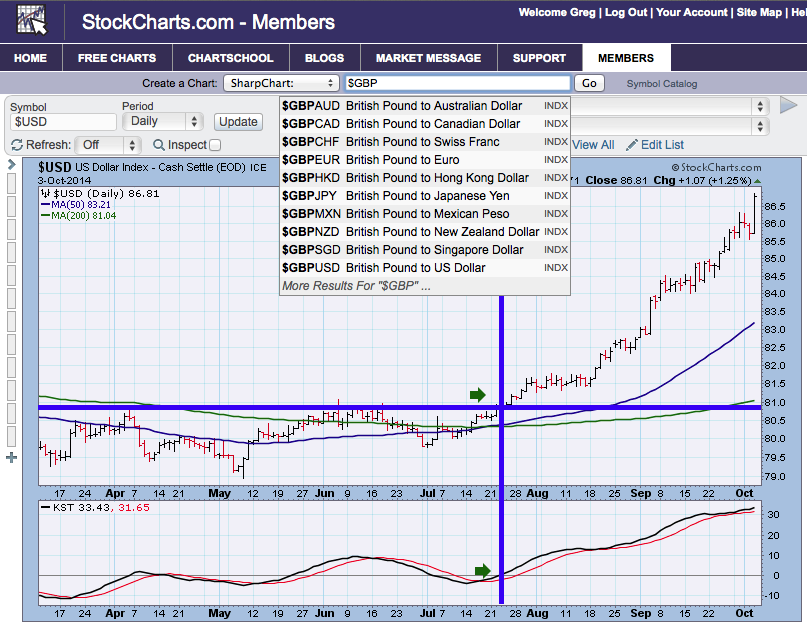
The easiest way to find these crosses are to type in one of the symbols with a "$" sign in front in the create-a-chart box. In the screenshot below, I typed in $GBP, and it shows a list of the pairs.
That will be very helpful in inter market assessments. If you like to trade investments in Europe or Asia through ETF's, this may help your performance by being aware of changes in the currency.
This is a link to the upcoming Thursday, October 9, 2014 4:30 EDT Webinar. The Canadian Technician Webinar. If you register in advance, we'll send you a reminder for the webinar. We are still improving how we work with the technology. You may need to adjust things on your end so everything works. Here is a helpful list. Getting Prepared For Greg's Webinar. Once you get this working smoothly and have the bandwidth it should work great. See you on Thursday (virtually)! Our plan will be to record these.
Good trading,
Greg Schnell, CMT
