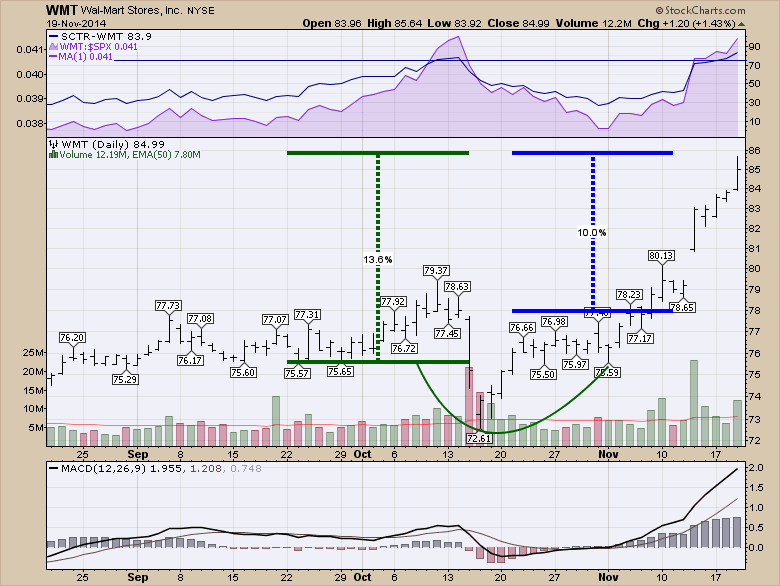
I have so many charts that feel important here. I have reviewed Walmart (WMT) before. But I haven't found many instances in recent years where the 'grocery store in every neighbourhood' stock rallies 10% on a breakout in 9 days. I find it a little hard to believe that the $270 Billion Dollar behemoth we know as Walmart put a new product at the end of the aisle that increased its market cap by $30 Billion this month! Here's the chart. Walmart is up $13.6% since the Nov 3 low and up 10 percent in 9 days.
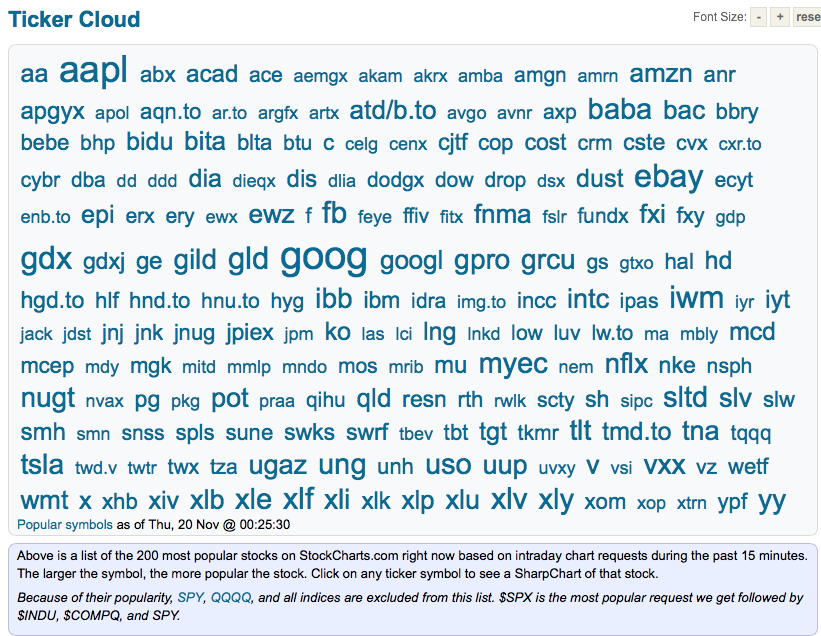
Well, after a contemplative day rolling through a massive number of charts, I couldn't help but say, Why Walmart? What is so special about Walmart that it makes it one of the fastest relative moves in 7 years of history this week? I say relative because the $SPX was up a whole 1.52% from October 31 close. Out of all the stocks in this little ticker cloud, why Walmart? Down in the bottom left a little 'wmt' sits in the corner.
Well, I have my curiosity spinning out of control with this question. So let me spin one idea and see if you agree.
First of all, let's look at the Walmart SCTR ranking through the history we have. I am struck by one major thing on the SCTR. The SCTR has gone above 50 when the stock market is correcting or going sideways. The SCTR went above 50 in the 4th quarter of 2007. It stayed there until...March 2009. Walmart was up 15% from October 9, 2007 to March 9, 2009. You can see it was not a smooth ride but it was a lot better than what most stocks were doing. The SCTR ranking stayed below 50 until July 2011. That was the month the stock market made a high before correcting almost 20%. Walmart actually went down less than everything else rather than rising. We can see WMT's SCTR pulled down briefly and shot back up for another 6 months in 2012. The stock market in 2012 had two hills in the chart as it tried to break above long term resistance. In the 4th quarter of 2012 QE came in big time and Walmart was out of favour. Recently, while I was in London, Walmart's SCTR had risen above the 50 level which was making me rather uncomfortable. After a sudden spike up and a pullback, we now see this massive move into Walmart stock. I particularly like when a stock rallies big time on the SCTR, pulls back and then starts its major run. Lets look at the other indicator on the chart.
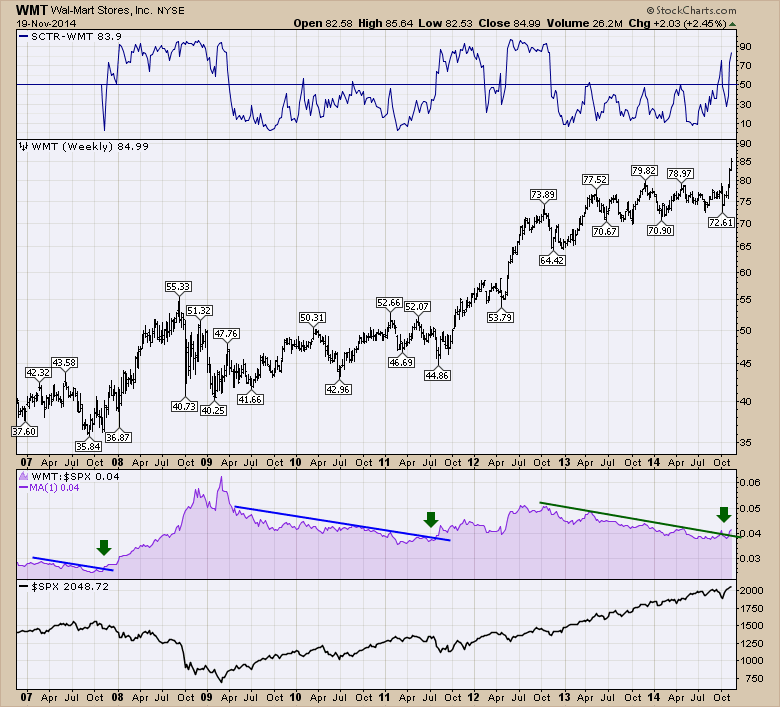
Sure enough, the SPURS shown in purple broke out above the downtrend. Now a lot of Walmart customers are getting to enjoy big breaks in gasoline pricing so a lot of investors are attributing Walmart's recent rise as the beneficiary of those spare dollars. The client base for Walmart has some of the smallest disposable cash on a monthly basis. I agree with that argument. But you'll also remember crude was down hard in both of these previous periods. So crude demand plummets when things slow down and shoppers head to Walmart when things slow down. Is that a correlation we can make? I think so. If nothing else, its a warning shot across the bow.
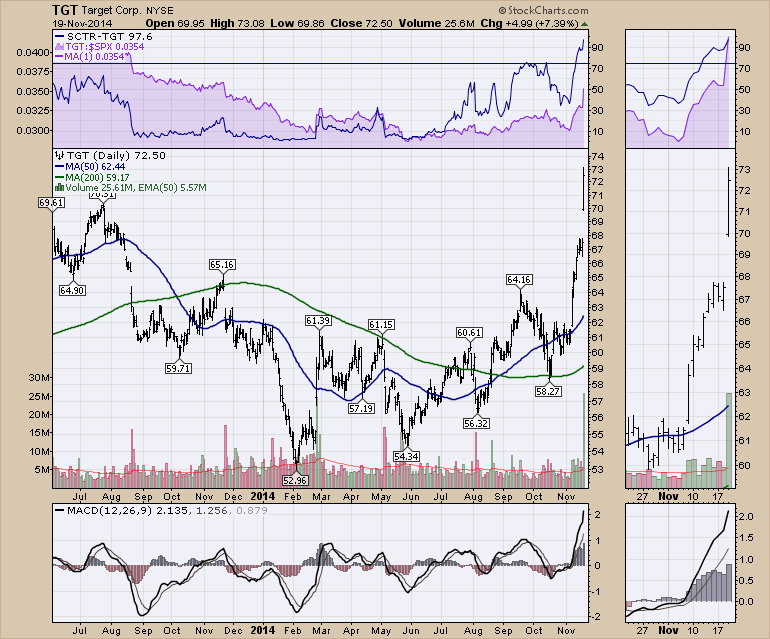
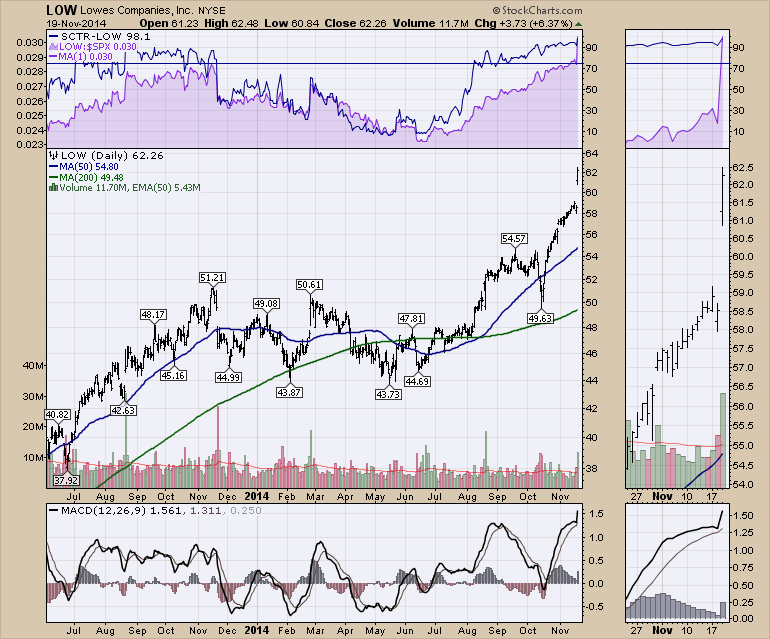
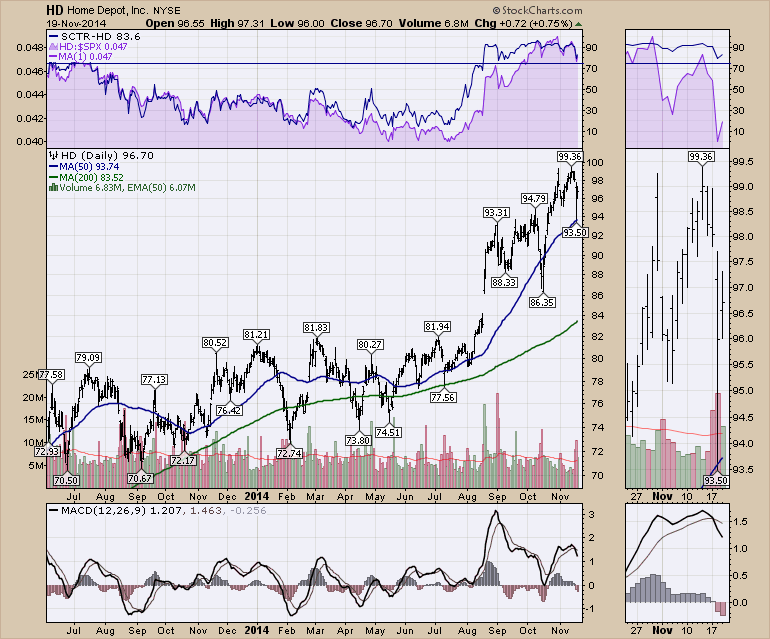
The other thing I am noticing is who are the sister stocks breaking to new highs right now. Target, Lowes, and Home Depot are all soaring.
Home Depot is 5 days off its high.
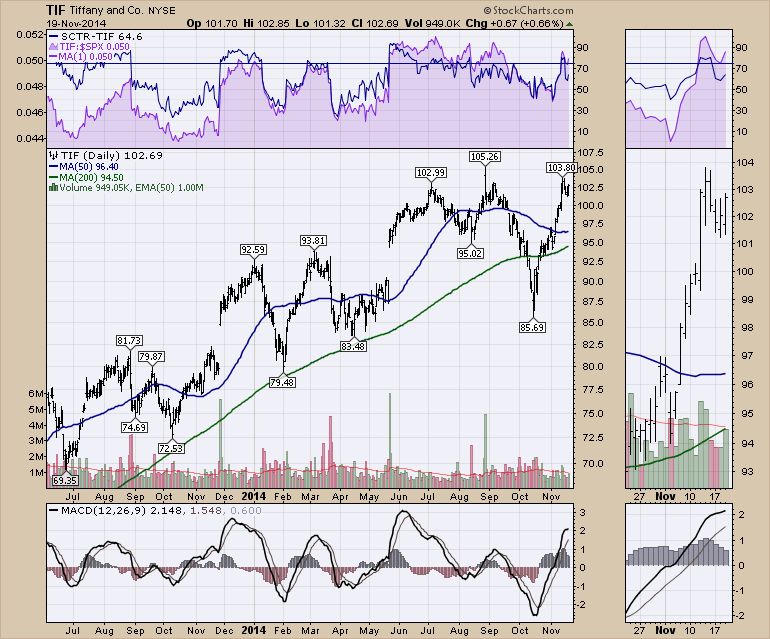
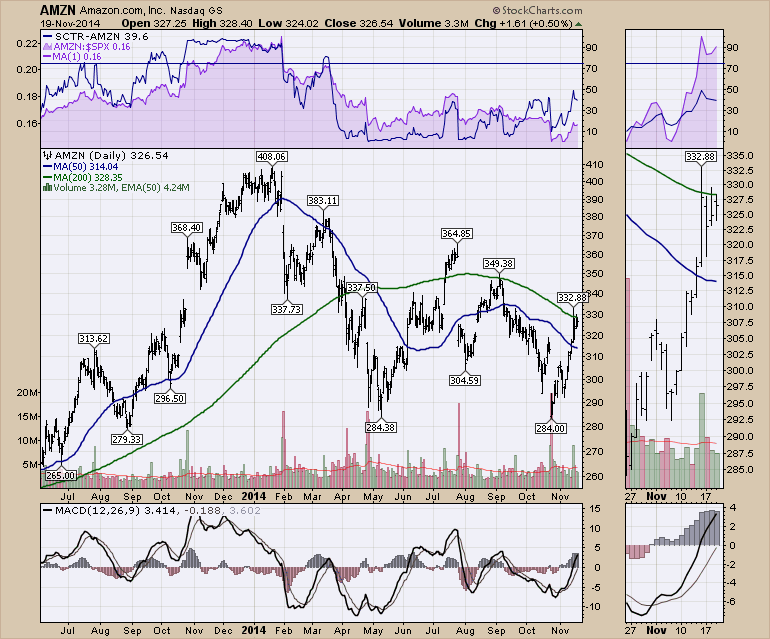
This is retail but its average priced retail. On the other hand, Tiffany is testing the 102 level for the 3rd time, while Walmart is up 10%. Its those dichotomies that have me pondering. While AMZN is a big retailer, they are a little thin on cash as they constantly reinvest. They are nowhere near their long term highs. So it seems to me to be the massive retailers with big balance sheets that investors are moving to.
Below we can see AMZN struggling with the 200 DMA. A break through there would be very important.
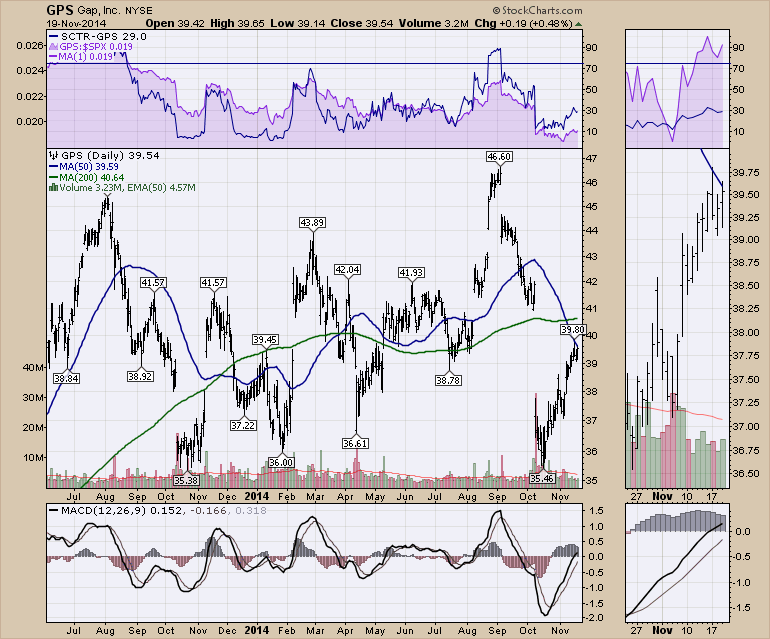
Here is GPS. Same beat up chart like Amazon.
While JWN (Nordstrom), LB (Limited Brands), M (Macy) still look good, the group of low price massive stores really seem to be the sweet spot.
I have a lot more charts on this concept but it is easier to explain in a webinar. I'll be hosting one of my most chart filled hours Thursday November 20th at 4:30 EST. That would be today! I have a bunch of charts currently that are making me hugely cautious. A rally seems to have enough strength to draw in the biggest non believer, only to turn around and go the other way. I hope you'll join in or take time to watch the recording. I plan on discussing if this is the start of the next bull market.
For attending the next “Canadian Technician” Webinar, Please click here to register.
Good trading,
Greg Schnell, CMT
