This is part 2 of a 2 part series on Apple through the stock charts. The first article can be found here. Winding My Apple Watch - Part 1.
First of all, let's connect to the previous article with the final chart in Part 1 starting Part 2. Apple's stock tripled from August 2004 to February 2005. The new look desktop was all the rage, the U2 iPod was available and the company continued to roll out new improvements in iLife software. The Mac computers were really starting to garner attention in the PC world as Windows continued to struggle with security. The iTunes store showed up in Canada and other countries around the world. The Apple retail store was accelerating and Apple was building on the ecosystem between the computer and the iPod. The glitz of the product announcements continued to impress the media.
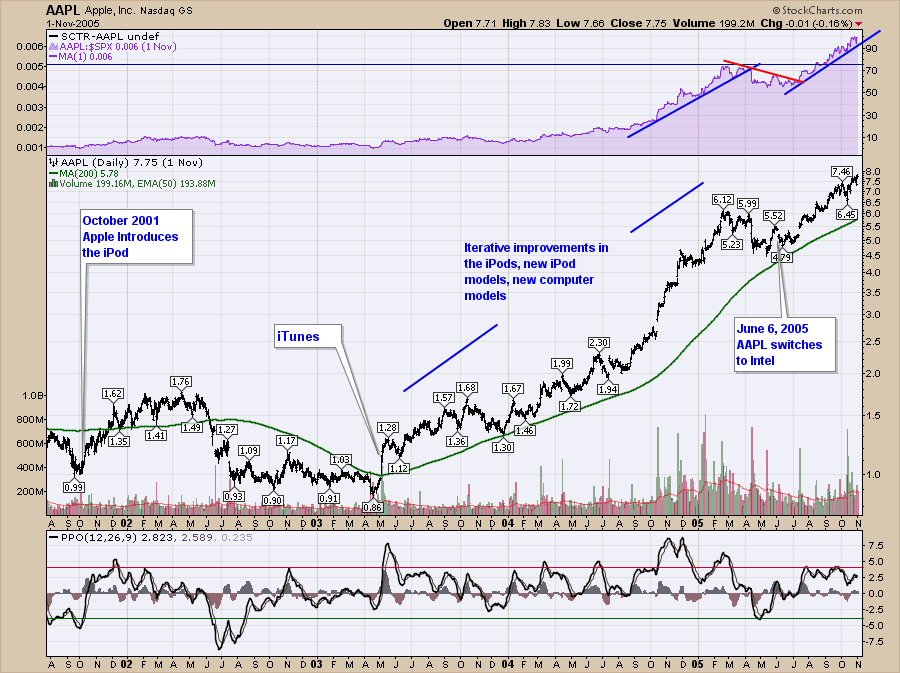
Chart 1
In February 2005, after a tripling in price in Chart 1, the stock was split 2:1. Apple made a big decision to introduce Intel chips which was a huge transition for the company. As Apple headed into 2006 with the Intel chip, it truly marked a surge in interest in the Apple computers. You could use windows software on your Mac. The Aluminum Macbook that is the Apple standard of today was rolling out. The iPod video was still surging in different colours and styles. The iTunes store was selling millions of songs over the internet quickly. This was going to be huge. 2006 could be an unbelievable year for Apple's stock price.
Moving to Chart 2, we can see how things worked out for Apple in 2006. The stock options scandal was snaring around Steve Jobs' neck and the company was dealing with the effects of this on the C-suite. The company was in a very powerful position with the consumer but the tension was big. Investors bailed. While it might appear that the stock split was a reason, it was the stock option scandal ensnaring many companies. Eventually that got worked through and Apple terminated a couple of senior individuals. The scandal was over. In a level of marketing never seen before, Apple opened the Fifth Avenue Store in NYC on May 19, 2006. The front door got more press than any other retail launch in the world. Apple had built a giant glass cube to make the store entrance grand for a store below ground level with no natural light otherwise. Steve Jobs patented the design and this iconic cube would be the standard for some of the stores in major world centres to follow. Istanbul recently opened a glass walled entry to a store below street level.

Chart 2
By July of 2006 the stock had lost 40% of its value in 5 months. The gap in July was a fabulous earnings release which started the road to doubling the stock by December 2006, yes, the same year. For the buy and holders, Apple was back above the February 2006 peak. Eric Schmidt of Google joined Apple's Board of Directors. What a power board! In January 2007, Steve announced that Apple was changing the name of the company and dropping Apple Computer for Apple Inc. With one more thing, Steve also announced the iPhone. Quite frankly it was amazing at the time. We were using flip phones and textual browsers. The internet speeds were brutal to do web surfing. Apple came out with a phone, a personal assistant, a touch screen, a real web browser like a desktop, the ability to seamlessly switch from wireless to cellular, and one more thing...it played music like an iPod. People were in awe. I know I was when I watched the presentation.
All the competitors were mocking Apple. You don't just step into an industry and change the world. Steve Ballmer of Microsoft suggested he really liked Microsoft's strategy and giggled at Apple's new product. Mr. Ballmer suggested "There's 'no-chance' the iPhone will get a significant share of the market. 'No chance.' " Olli-Pekka Kallasvuo of Nokia welcomed them (Apple) to the party. Jim Balsillie suggested the iPhone's impact on Blackberry's business would be minimal. Palm, Ericsson, Sony and Motorola were all about to be hit by the Apple that literally fell onstage on January 9, 2007. Microsoft, Nokia, Sony, Blackberry, Palm and Ericsson's phone businesses would all be crushed as we now know. The decimation to shareholders in many of those firms were legendary. Sony had now experienced Apple's crush twice. One on the wipeout of the Sony Walkman, the next on the Sony phone.
I have duplicated the 2005- 2009 Chart 2 in Chart 3 so you don't have to scroll so much. With all of that hype on the announcement, the stock fell 15%! From February to December of 2007 the iPhone was all the rage and the stock soared 150% off the February lows. Blackberry enjoyed some investor love until the Global Financial Crisis in 2008.
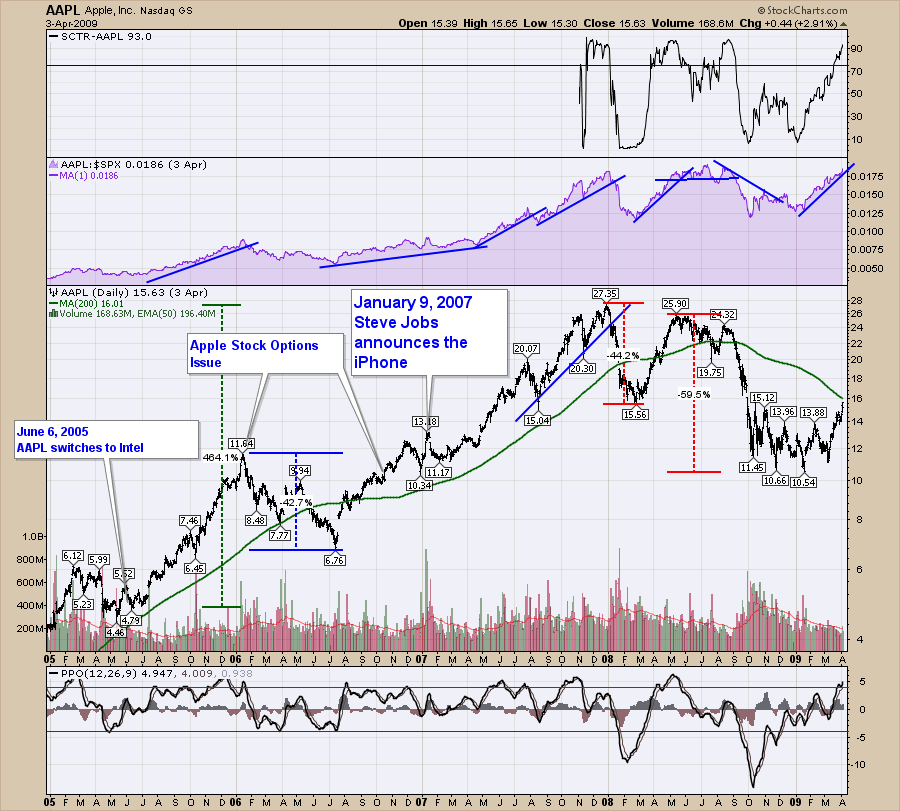
Chart 3
In late December of 2007, the S&P 500 moved below its 200 DMA, as Apple sat near its all time high. With the blend of the iPhone, the iMac, the MacBooks and the iPod, this Apple was not to be harvested, it was doing the harvesting. Well, not so fast. The influence of the Global Financial Crisis reached far and wide and investors were starting to take profits wherever they could. In 6 weeks Apple was down 40%. It rallied 70% off the February lows, only to retrace another 60% from there into the fall of 2008. Imagine having that lineup of products, profits rising every quarter and the stock falling below the start of the iPhone's launch. Quite frankly remarkable. Walmart was up 15% in the Financial Crisis and Apple was down 62% from the highs.
It all looks so easy in hindsight, but there are still some lessons for me here. Let's bullet list a few of these here.
- The PPO of 4% on Apple was a pretty good level to be suspicious of.
- One method of profit protection is to keep selling a portion as the stock goes up so that it is never more than 5% of your portfolio. For all of us, learning to take profits is hard to do when everything looks so favourable. Opening a chart up wide and picking a level of momentum specific to that stock is important, I think.
- The SPURS can be important in helping decide on an exit. When my strong stock starts to under perform the broad index, that is definitely telling us that the investor sentiment is changing and perhaps my sentiment should be too.
- We now have another method with the SCTR ranking that StockCharts initiated in 2007. If you are going to be in a great stock, the SCTR is above 75. So that is one simple criteria for finding a great stock. If it doesn't get about 75 on the SCTR it is just an average stock and the index is probably a safer investment. The big clue from the SCTR is that the stock will cycle in and out of investor favour. If you protect your investment through different sorts of methods like options, selling a portion near the highs in momentum, or when the stock starts to under perform on relative strength or the SCTR, you can ensure you lock in some of the gains.
- Nothing wrong with selling a 1/3 , a quarter, or 1/2 a position with big gains.
- You just never know when they are going to miss earnings for the first time with an example being Apple in 2000.
I know investors that have held Apple from $15. They have endured multiple 40% losses (even 60%) of the accumulated value. There will come a day when every stock will have reached its final peak and a holding strategy without an exit means I'll lose all of my gains. I decided to cover this off here at Chart 3 before we expand into the next area for Apple which will take us up to the current time. By analyzing this now, it takes some of the current euphoria away and let's us analyze a strategy without the current pressure of momentum and giddiness of the recent gains. With the stock rising relentlessly into 2007, with the greatest product lineup the consumer electronics group had ever seen, the stock still fell 62% in less than a year. Apple was firing on all cylinders.
Let's briefly analyze another high flying stock in this period. Blackberry had senators and the next President of the USA as ambassadors for their product and the stock ran up and down in 2008 with similar trending as Apple. Blackberry was making new highs in June 2008 while AAPL was making lower highs so the love for Blackberry at the time was unwavering. Cramer has a hard job to get it right every day but the charts can help us have our own opinion. In the month of June 2008, I am sure that some investors were following Jim Cramer when he was expounding the "how great thou BBRY stock are" religion. Here is a link from Crackberry.com back on July 31, 2008. Chart 4 shows Blackberry (BBRY). Even at today's prices where some recent (2013) Blackberry investors have doubled their money, Blackberry buy and holders from 2008 have lost 93% of their investment. I have shown Blackberry (BBRY) with a MACD instead of a PPO just to complete the loop on the PPO from Part 1. I don't want to inject a MACD into the AAPL charts in this series and cause confusion. The moral of the story is we will never know when the final high is in, until well after the fact, but we can use tools to help identify changes in the stock behaviour relative to the rest of the stocks. This opportunity provided by charts will cause whipsaws to occur so it still doesn't make it easy. Probably the best gauge for when to sell is: when I am touting how good my stock picks are over a beverage with friends, I should be taking some profit protection action! Why is it when I confess my losers, the losers don't start improving?
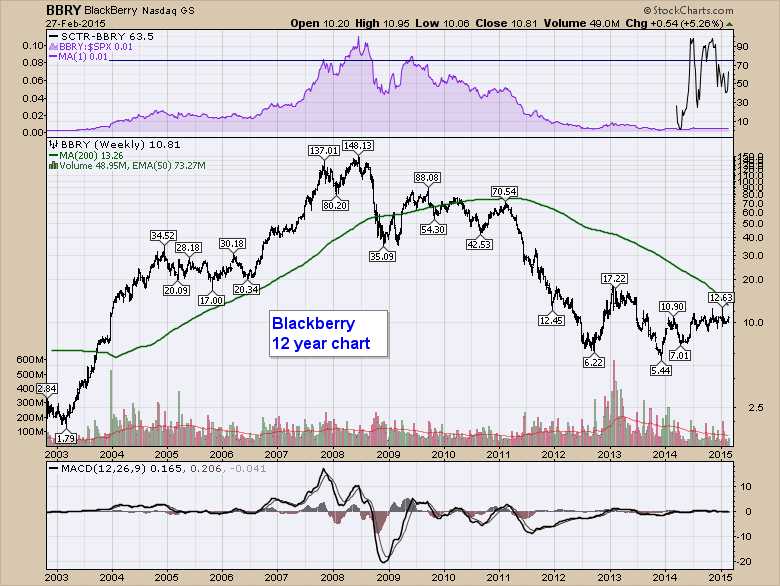
Chart 4
Back to the Apple in hand. Chart 5 brings us the recovery off the 2009 lows. From January to June 2009, Steve Jobs is off work to deal with health related matters. In August Eric Schmidt resigned from Apple's board due to conflicts of interest and the Android phone strategy by Google. The change didn't dent the stock but it made Steve declare Thermonuclear war on Google in the biography of Steve Jobs. That battle still rages. Back to 2009, Apple was iterating improvements to the product lines but the investors waited anxiously for the next product to wow the world. The iPhone was selling great and everyone loved Apple. In January 2010, Steve sat on the couch on stage and read the news on his iPad. Product jokes were everywhere about the name. Everyone decided it was nothing special. It needed USB ports, it needed to be smaller, it needed to be...whatever. The product was launched to much fanfare but a lot of people estimated it would have little traction. Again the stock pulled back a few percentage points now that the hype was over. Then schools grabbed it for teaching and web browsing by touch became popular. Leaving an iPad on the kitchen counter gave you instant access to recipes and sports highlight reels. The adoption was fantastic and the stock tripled over the next two years. Another success story where others had tried with limited success. The popularity of the ecosystem between the iPhone, the iPad and the computer had everyone buying more Apple stuff. Looking at the indicators on the chart, the SCTR was above 75 for almost the entire four year period with 2 solid years off the 2009 lows. In January 2011, Steve announced he would be off work for medical leave of an unknown duration. The stock lost some of its mojo and pulled back 15% over the next 6 months. In August 2011, Steve resigned his position as Apple CEO because he could no longer meet his duties and expectations. On August 9th, 2011 Apple became the world's most valuable company. Then, on October 5, 2011, Steve Jobs passed away at just 56 years of age.
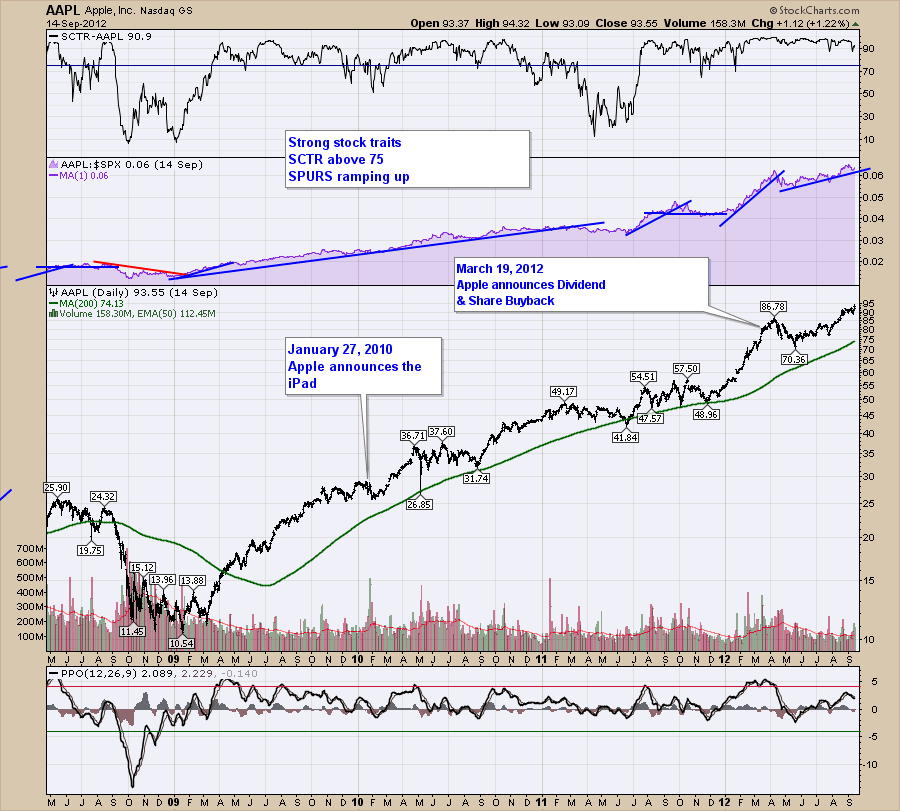
Chart 5
As Tim Cook stepped in to take the reigns of the world's largest corporation, investors were wondering if this would be a company like Starbucks that lost momentum when Howard Schultz stepped down or like Dell when Michael Dell stepped down. The stock traded in a range from July 2011 to December 2011. In January 2012, Apple iPhone 4S arrived in China. The stock responded with a 50% move in 2 months. Not everything was rosy in Tim Cook's office. Now that Steve was gone, the activist investors were kicking Cook to boot some loot back to the shareholders. In January 2012, Apple reported a corral of cash totalling $97.7 Billion and by the time Apple reported earnings in late January, it was over $100 Billion. The activists wanted a large chunk of the pot of gold which was Apple's surplus cash. By March, they had cooked Cook in the CEO Suite enough to boil up some dividends. Apple announced the long awaited share buyback and dividend program to much fanfare for Wall Street. Wall Street had finally convinced another tech company to spit out dividends. After a few weeks of continuing higher, the stock dropped 20%. 2012 saw the stock absolutely rocket as the world's largest company. Everyone, including me, feared the law of large numbers would set in. Between January 2012 and September 2012 the stock had almost doubled. The App Store, iTunes, and iCloud were spitting out unfathomable numbers for participation. The App Store had 25 Billion downloads. The latest iPhone had sold 5 million in one week. Not bad for a new product. Through all of this was a very public court case between Samsung and Apple. Apple was also taking their own maps application icon and putting their own version of maps behind it to remove Google's influence and associated ad revenue from maps. Big boys play hardball. Apple announced the map change in June and it went live 5 days after chart 5 ends. We better move to Chart 6 below.
First of all, the dotted line on the Chart 6 is where Chart 5 ended. This absolutely phenomenal company with earnings and revenues growing every quarter had the world by the 'i'. iPhone, iPad, iMac, iPod. Everything was on track. But the actual rate of growth was slowing. Investors started to sell the stock in September 2012. The selling continued until June 2013! Two things happened that were coincident around the 2012 market top. The Federal Reserve announced QE and all stocks pulled back for about 6 weeks. However, when the rest of the stocks started accelerating again, the Apple stock continued to fall. The purple line has a massive downward slope. So even though the company was still firing on all cylinders with Retina displays, new iPads, new phone models, iPhones in China, iTunes rolling out around the world, customers moving to their cloud (iCloud), Mac computer sales were increasing almost every quarter and the world couldn't look brighter, the stock sold off 45%. I want to hammer this point home. It is not when the earnings actually start falling, it is when the investor community thinks the bulk of the share price profits have been made, that the stock starts falling unsupported. 2013 had iterations on old products but no new growth platform. The stock price oscillated from August to April 2014. So did the SPURS and the SCTR. The PPO topped at the August 2013 high around 4%. A fantastic earnings report in April 2014 launched Apple back up to new 52 week highs and the SCTR shot back above 75 and stayed there until January 2015. The SCTR spent the month of December declining but Apple turned around and spent the month of February rising about 25% (yes in a month!)

Chart 6
That brings us to today. We are heading into the single largest product launch in the world. Three days ago, on February 26th, Apple announced a special event called Spring Forward which is expected to be the launch date for the Apple Watch on March 9, 2015. The euphoria this week has gone well past the euphoria of landing a lunar module on a comet as the total market value of Apple shares crossed above $750 Billion. Everyone is talking about the Trillion Dollar Company which of course is a stretch of $250 Billion. Apple was also hit with a law suit this week that it is poaching battery engineers from other companies that make car batteries. That fired the rumour mill to a new euphoric level and even had the Mercedes Benz leader talking about Google and Apple in the car space. According to Reuters, Apple is worth more than Daimler, Volkswagen, Renault, Peugeot, Fiat Chrysler, Ford and General motors put together. After Tesla's recent success, there is a reason to believe new firms could play in the car business. So with the world awash in Apple love, I am watch-ing the charts. I have duplicated Chart 6 in Chart 7 to avoid scrolling syndrome. Here is what I see.
It is not uncommon for the stock to run up into a product announcement and sell off after. We currently have the PPO at 18 month highs rolling over after being above 4% again just like it was in 2013. The rate of ascent into this high on the SPURS is dazzling which also suggests this will be difficult to maintain. Because Apple is so large, it looks like a new Apple Watch product launch could potentially threaten Swatch (SWGAY) which is already 30% off the highs and Fossil (FOSL) which is closer to 40% off the highs. Apple's success in crushing other companies is legendary and Apple Radio steam rolled Pandora (P) last year. The Apple Watch product has the genius of Jonathan Ive wound into it. With major watch manufacturers shunning Apple's design style as trash and a level of sophistication that a rookie designer might draw, it feels like we have heard this story before. With the staggering corral of cash, expect Apple to fix any shortfall quickly to make sure they have a success on their hands. The difficult part for any competitor is the way the Apple Watch integrates into the iPhone and iPad, into an existing App Store, iTunes store and the iCloud, with rumours abounding that the watch will also be able to control the Apple TV. The Watch needs an iPhone so will that migrate even more people into the Apple ecosystem? Will that be a hurdle and force Apple to make apps on Android so the watch can talk to those phones? How much will the high end Apple Watch cost? Rumours have it between $900 and $10,000 which demonstrates that Apple has done a good job of keeping some surprises for the 9th. The future looks bullish, the technicals looked stretched. Will we be able to buy the Apple stock 20% off later this spring? Or will it just be later in March? No one is shorting AAPL as you constantly get your empty wallet handed to you, but the PPO and the SPURS have given a protect profits warning. I find the SCTR too slow for advice in selling.
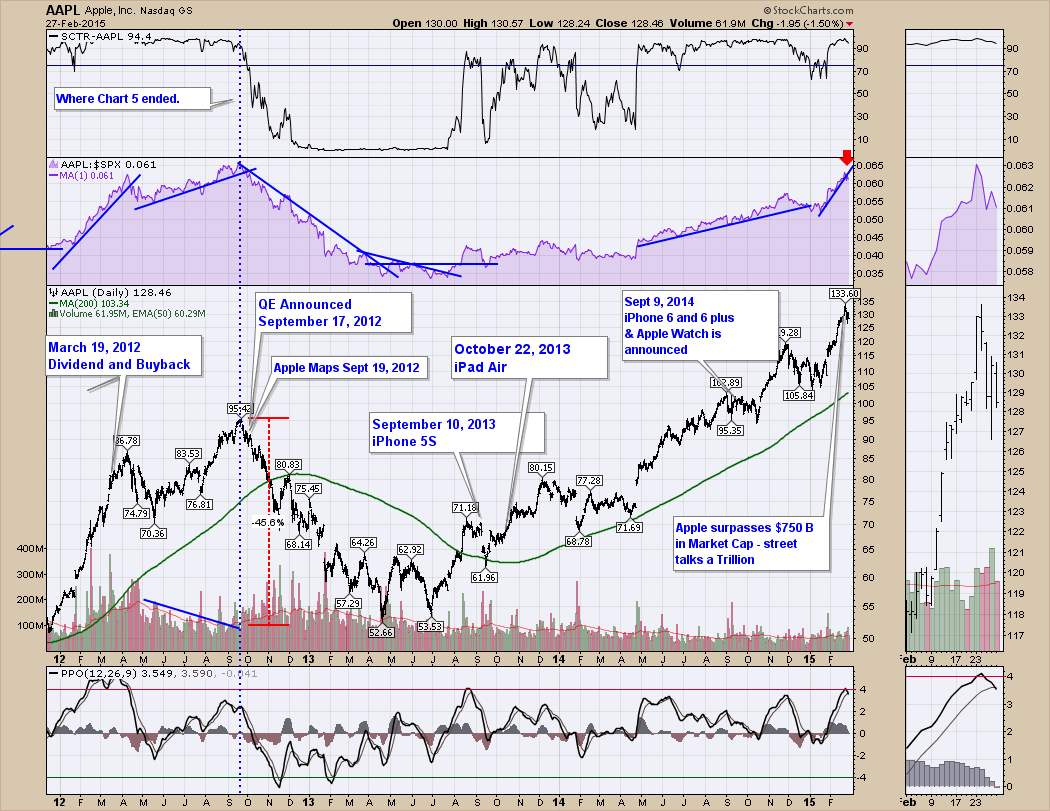
Chart 7
I would expect Apple to be higher later in the year as I expect the Apple Watch to be a success. It doesn't matter what I think. Make sure you have a plan to get your profits based on your signals. If you are not in Apple and want to be, what are the signals you plan to use to help you buy the stock on weakness? Lastly, how much profit the company makes is not how the share price is decided. It is a factor in the decision. Follow the investor sentiment. When the rate of growth slows, I think the institutional selling will begin in earnest. Because Apple is so large, they need a tremendous rate of adoption and their ecosystem supports that growth which is why investors own the stock. I hope I have demonstrated how 2 or 3 indicators on the charts can help you know when to hold 'em, know when to protect 'em and know when to fold 'em. That way there will be time enough for counting when the stock is done its run. Depending on your time horizon, you will need to have a strategy for action. This article is not trying to tell you what to do on Monday other than to have a plan. Analyze the history of the stock and the indicators. It's never easy. You may disagree with all I have written and that is ok too. That is what makes a market.
For the record, here is when Blackberry (BBRY) recorded their first decline in sales. The stock was already 89% off the highs. Remember when the ticker was RIMM? RIMMember when?
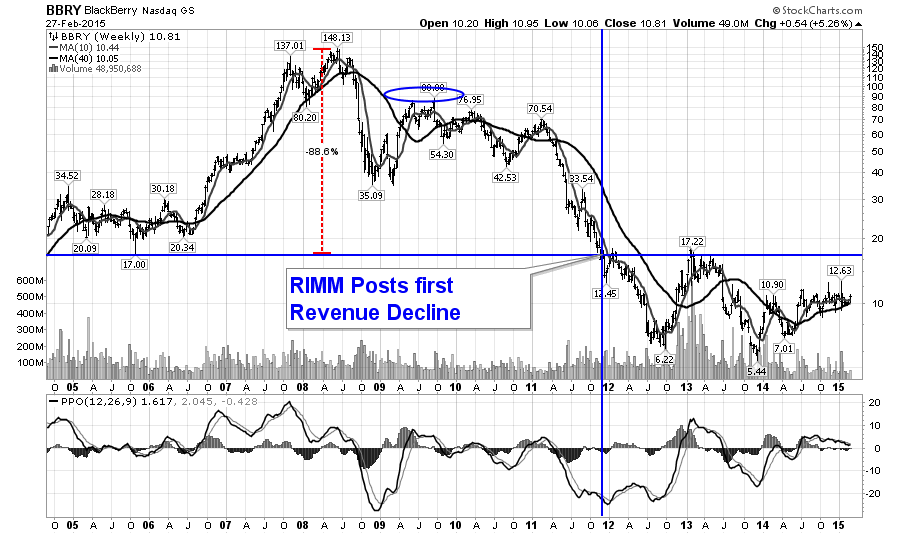
Chart 8
Lastly, here is a picture of the story so far.
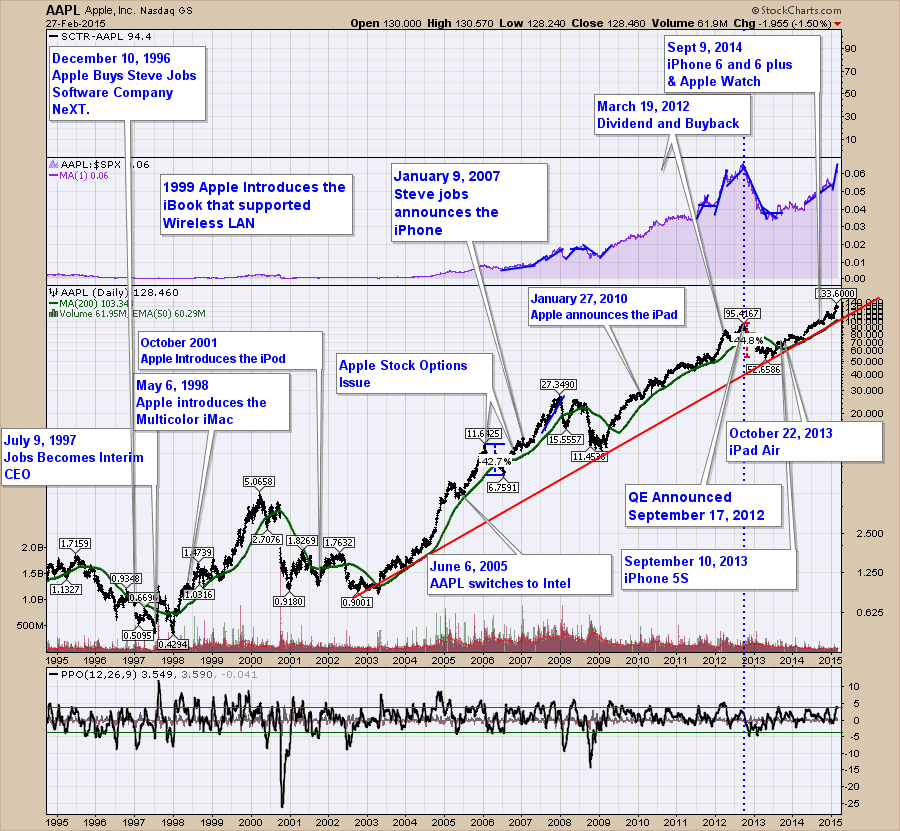
Chart 9
Just for the record, I own an Apple desktop, a Macbook, an iPad and a iPhone. I am an Apple follower and love the products.
There are so many opportunities for 'the moral of this story' here, but I'll leave it with have a plan that suits your time horizon. Oh how boring! How about 'A Watch-ed Pot Never Boils!' Oh, how bad! Feel free to leave some comments in the comments section! Thanks for following along.
Good trading,
Greg Schnell, CMT
