Recently the US banks have been soaring like they are drinking some kind of Kool-Aid. JP Morgan (JPM), Citigroup (C), Bank Of America (BAC), Wells Fargo (WFC), US Bankcorp (USB) have all been surging higher. Goldman Sachs (GS) and Morgan Stanley (MS) have followed. Time to do a little competitive comparison as I see the building names on the skyline here in London.
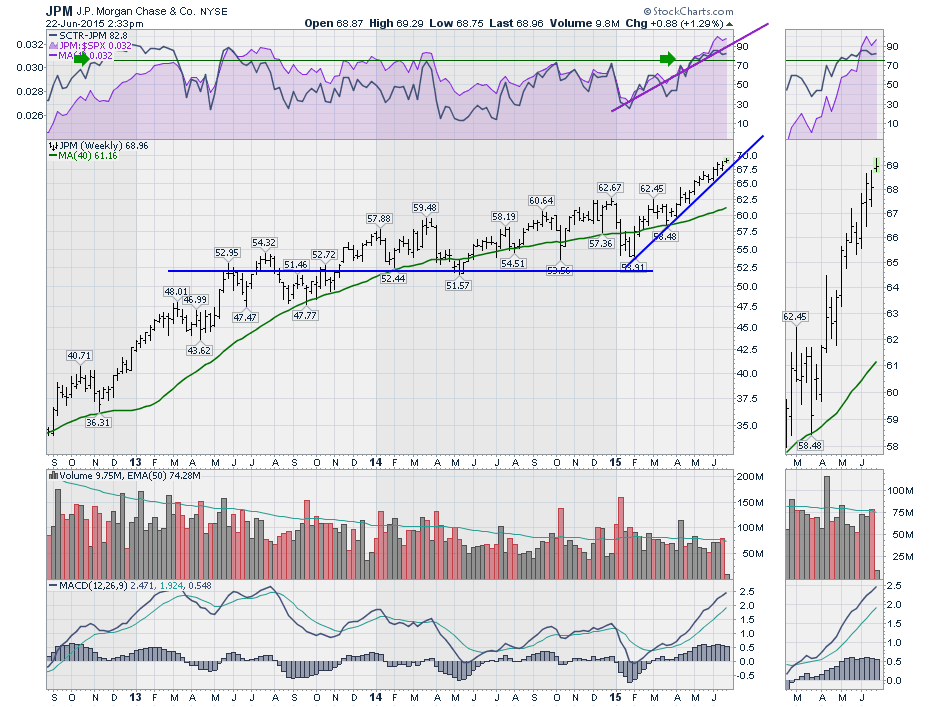
Starting with the grand daddy, JP Morgan (JPM). The purple SPURS is soaring to new heights. the SCTR has been above 75 the longest since 2013. Bullish!
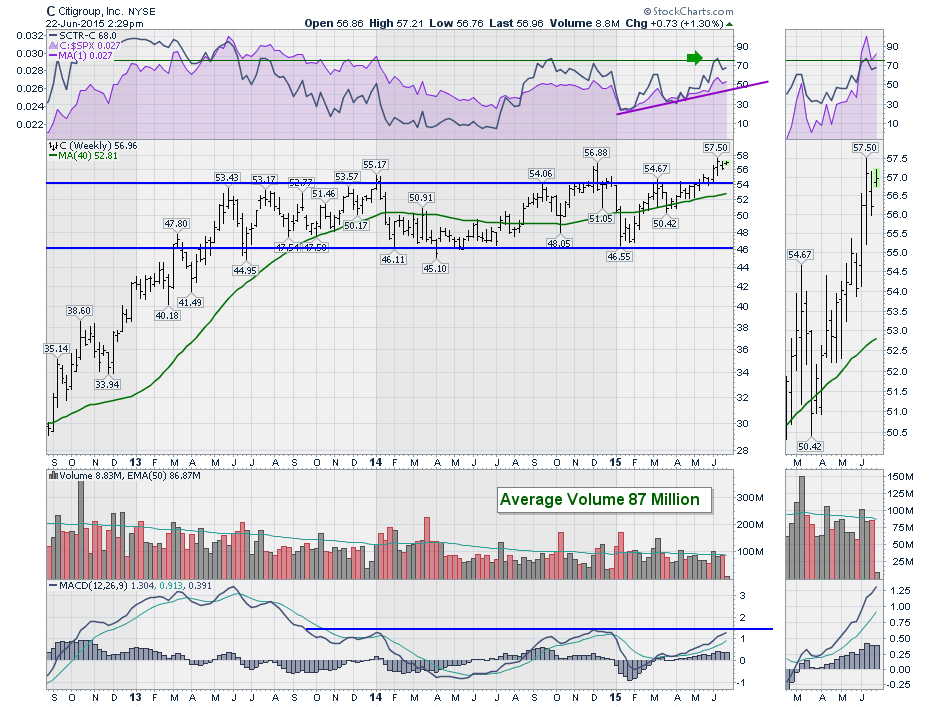
Citigroup (C) pushed to new 6 year highs. Bullish as long as the SCTR stays strong. Citi pushed to new highs two weeks ago and has not really moved since so we have to be careful. We like them to break out with conviction. This one is stuck in first gear. The volume has been consistent with a flat MA of 87 Million.
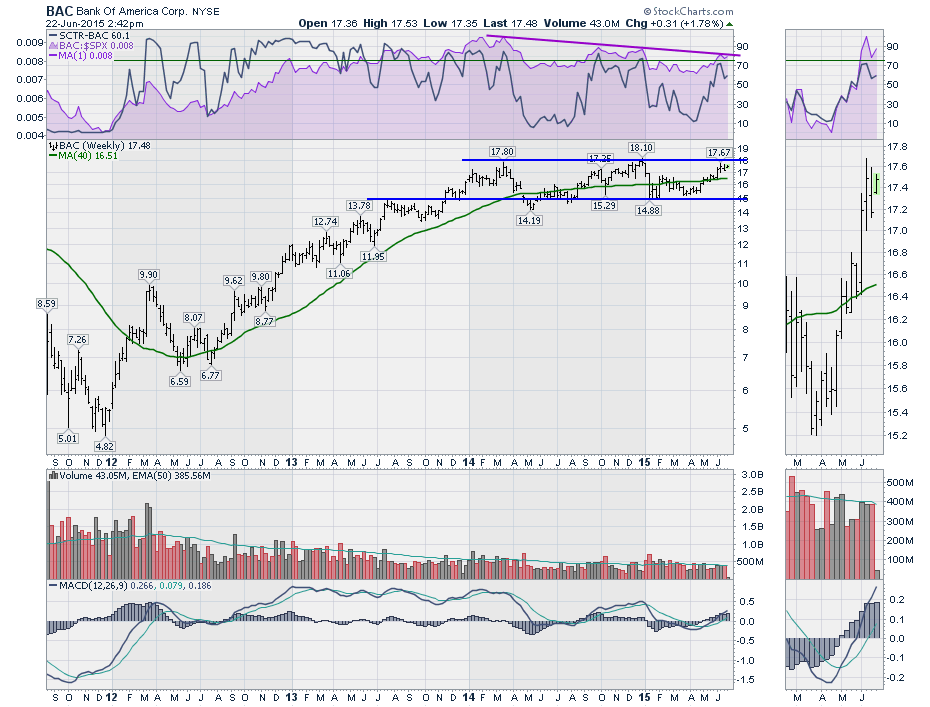
Bank of America (BAC) is an amazing story for the history of investing in distress. Warren (that would be Buffett) jumped in around $5. I added an extra year so you could see the entry. The jump from $5 to $8 would make you feel great when you added $5 Billion! While BAC has not broken out yet, the chart is not as strong as the others. However, testing the highs is always bullish. The MACD momentum and relative strength are trending down, so that's a little worrisome about a topping pattern. Volume trending around 500 Million a week. We'll be watching for a breakout. Maybe this chart will wait for the Fed to move before it breaks out.
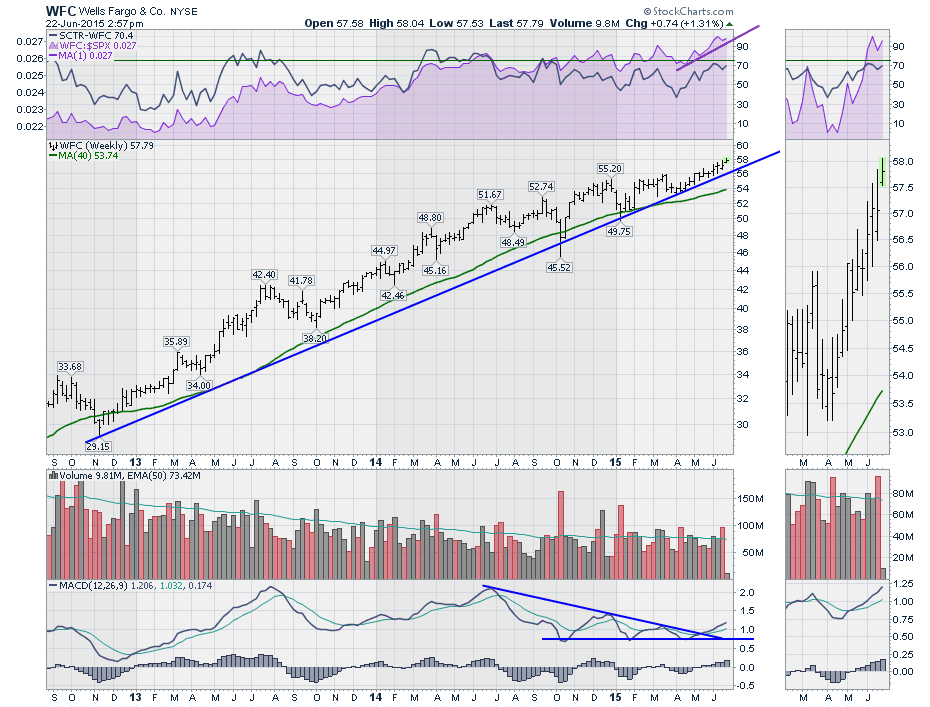
Wells Fargo (WFC) may just be using the corporate chuckwagon to climb this wall of worry. Tight price action week after week looks stable. It has taken 8 weeks to hobble $2.00. That's not bad, just very slowly on a fresh new high. Chart looks fine but the SCTR says its a middling' stock between 30 and 70 which isn't the easiest hold. Its up from $50 to $58 which is fine in a year. Almost half of that gain was the last 7 weeks.
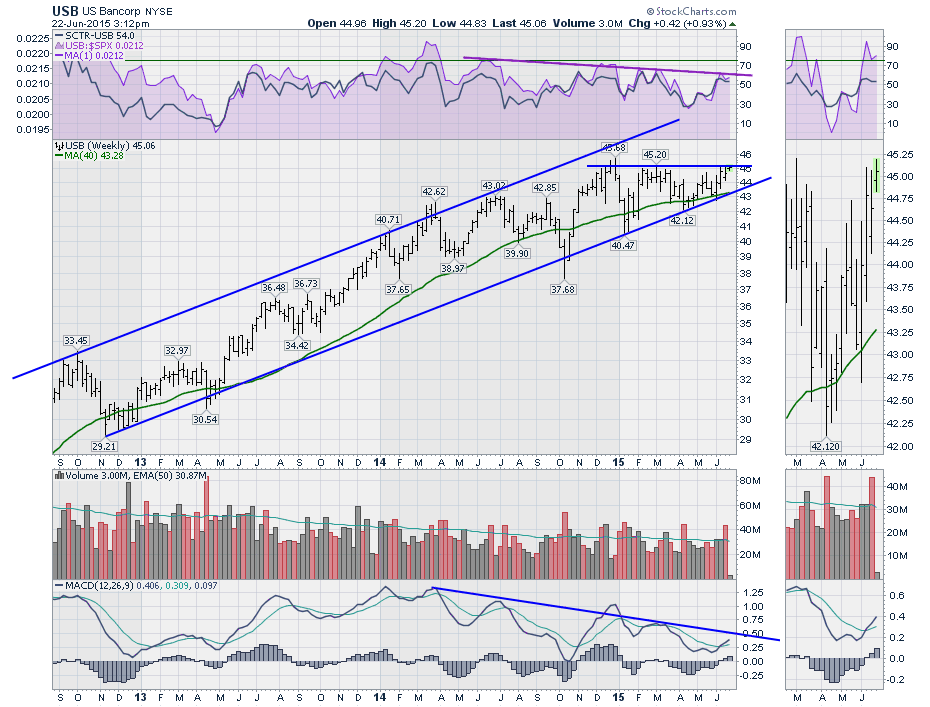
US Bancorp (USB) is always a nice chart. The tradition continues. The chart is flat on the 2015 year to date, but up 5% from a year ago. The SPURS are down sloping and the SCTR is at 54, which is barely above average. Nice stock, just not aggressive.
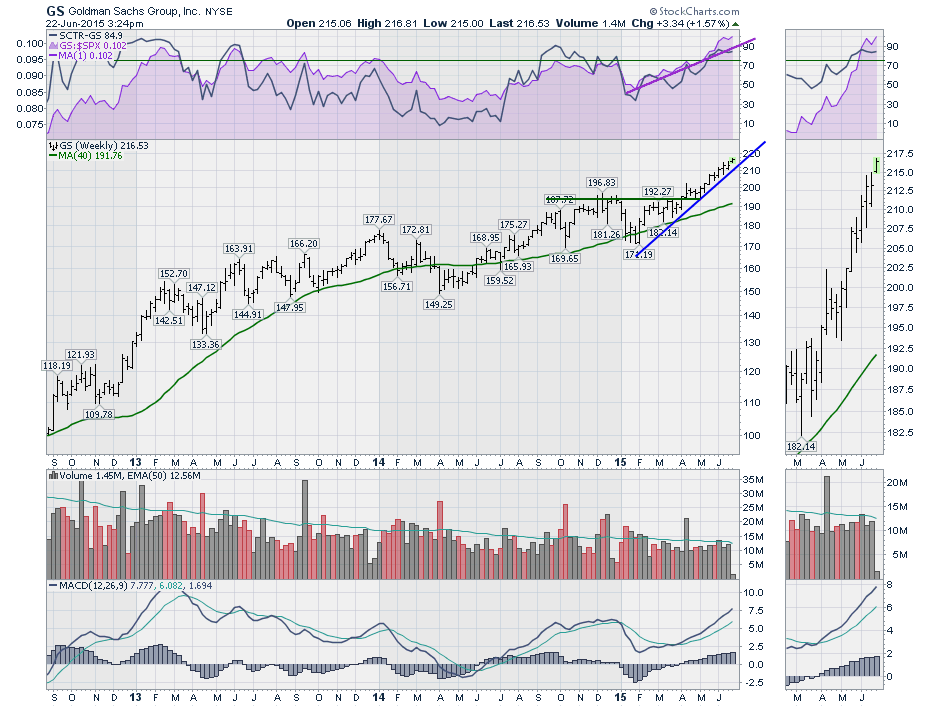
Here is Goldman Sachs (GS). Big uptrend bullish. Brokers are leading indicators... Bullish.
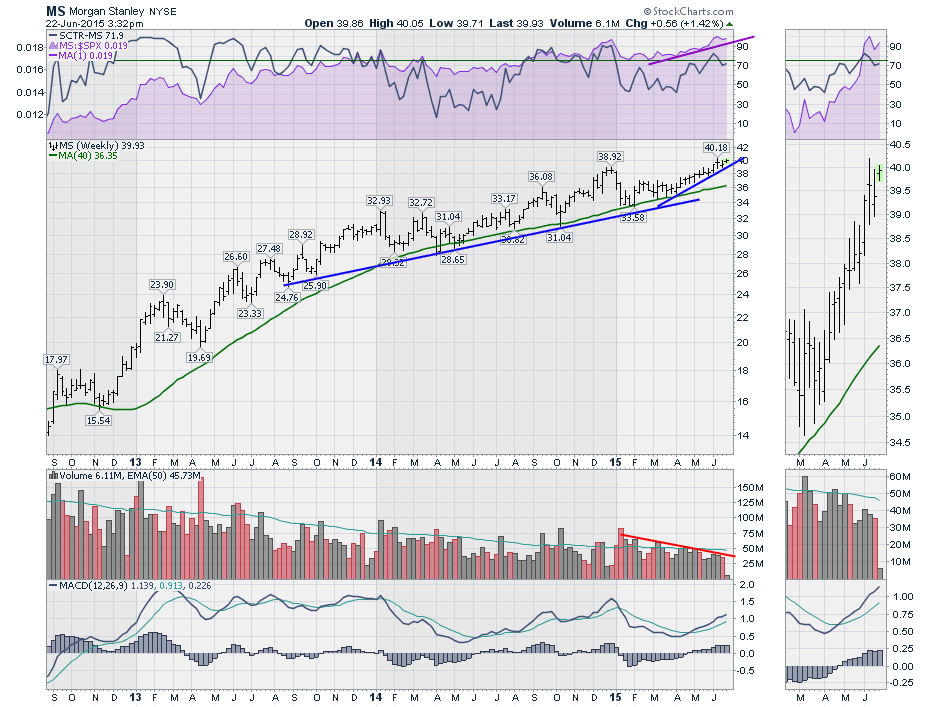
Morgan Stanley (MS). SPURS are climbing, new highs, tight price action. Bullish. Outperforming 70% of the stocks on the SCTR. Volume has been declining on the rise which is a little worrisome but we could say that for 3 years!
As long as the purple SPURS hold up, that looks good to me. Nice and strong. The US banks still look good, the Canadian banks not so much. I'll write a separate article about them, but they continue to look weak.
Good trading,
Greg Schnell, CMT
