Global stocks were dropping on the back of some weak Chinese news is the way the media portrayed the event. Is that what really happened? Definitely not. The market internals have been getting weaker for months as the RSI shows on the Dow. Commodity demand has been dropping if not plummeting globally which I believe illustrates the lack of global economic growth. The US Dollar ($USD) has gone sideways after last year's acceleration from July 2014 to January 2015. But commodities have continued to fall, even though the $USD is a lot weaker than January. The July earnings season was average to weak with everyone blaming the $USD. It takes a while for a strong dollar to show up in the financials. It also takes a while for the weakness in the energy sector to flow through and show up in other sectors. I think this energy sector weakness is one of the strongest global headwinds.
Let's look at some of the charts and you can make your own opinion. I want to highlight some of the technical indicators that illustrates a slowing global scenario to me. Many of the world's largest companies are in the $SPX and it is usually the last to fail. Many of the blogs and webinars have been demonstrating the weakness underlying this market but the $SPX has been so resilient.
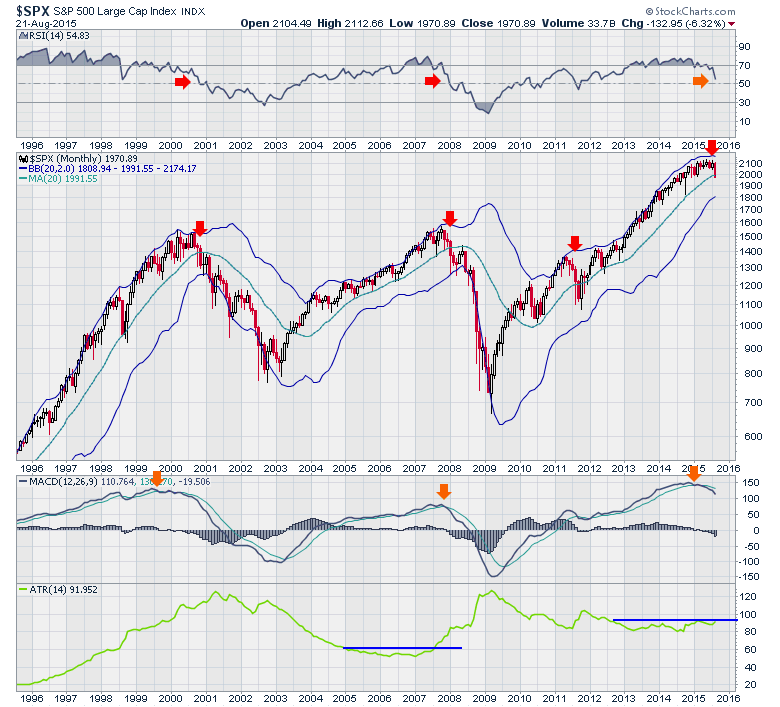
On these charts, we'll just go around the world and look at each chart on a monthly chart. Notice how important closes below the 20 month moving average (MMA) are, so I marked the low closes with arrows on the price chart. It is also very important when charts around the world break below this level as a group. RSI falling below 50 on monthly charts and staying below 60 is important as that typically marks a bear market. The monthly MACD with a negative slope is usually a big problem and a rising average true range is a big deal to me. Sometimes the narrowing of the Bollinger bands can be a big clue. Arthur Hill and I have been writing about this and it is usually reflective of a change in trend but not always. The Bollinger Band pinch has been very notable on the weekly charts but I want to run with monthly here. Let's start with USA and keep in mind that we still have a few trading days to rebound. These charts show the monthly close and the close below the 20 month MA (MMA) is what I want to focus on.
The rising ATR in 1996-1999 was not a reason to worry, but it was when it was part of the rest of the signals. Keep in mind what a behemoth the $SPX is and it is the last to fall usually.
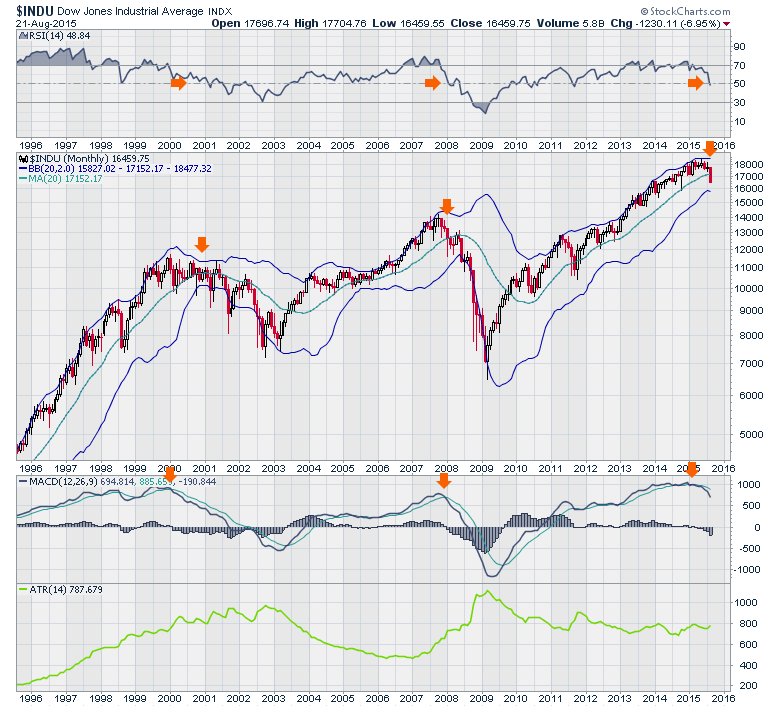
Here is the Dow. Same symptoms but the RSI is below 50 now. The ATR has not broken out yet.
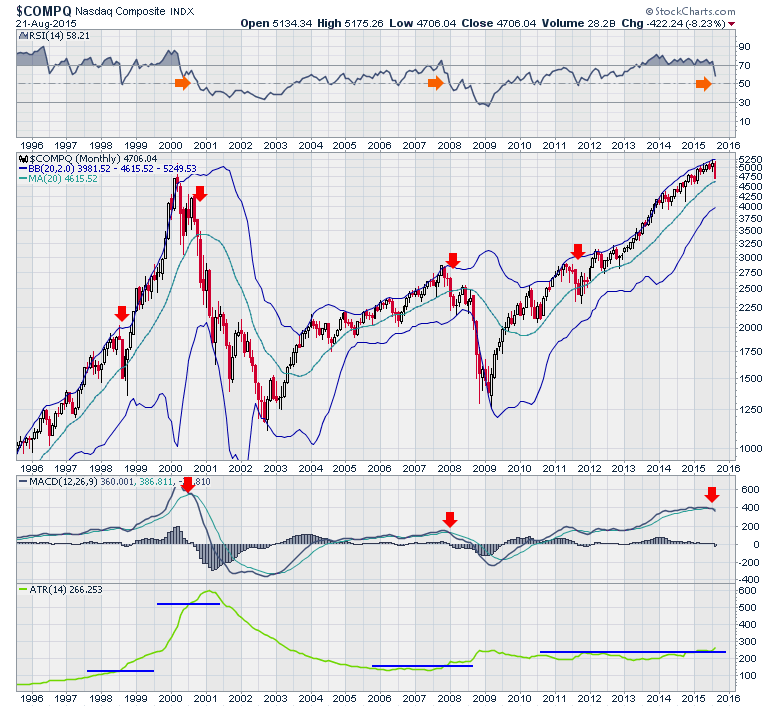
Here is the Nasdaq Composite. $COMPQ. We will watch to see if the 20 Month MA will hold up. So far the only signal is the monthly MACD cross. Will it hold until the end of the month?
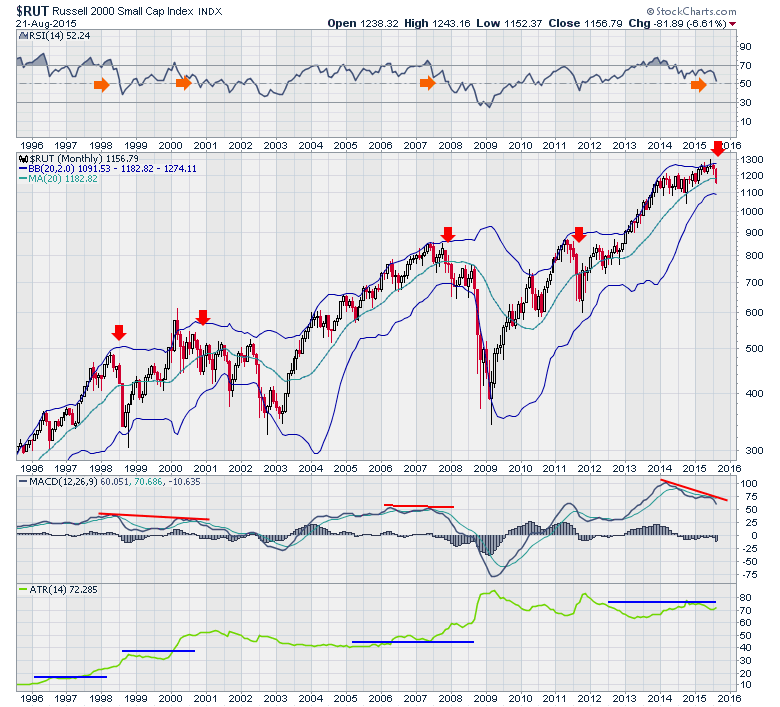
Here is the break on the Russell 2000 ($RUT). We can see the MACD is a problem with a negative slope for a year. The RSI is testing 50 now. The price has broken below the 20 Month MA. The ATR is not generating any signals.
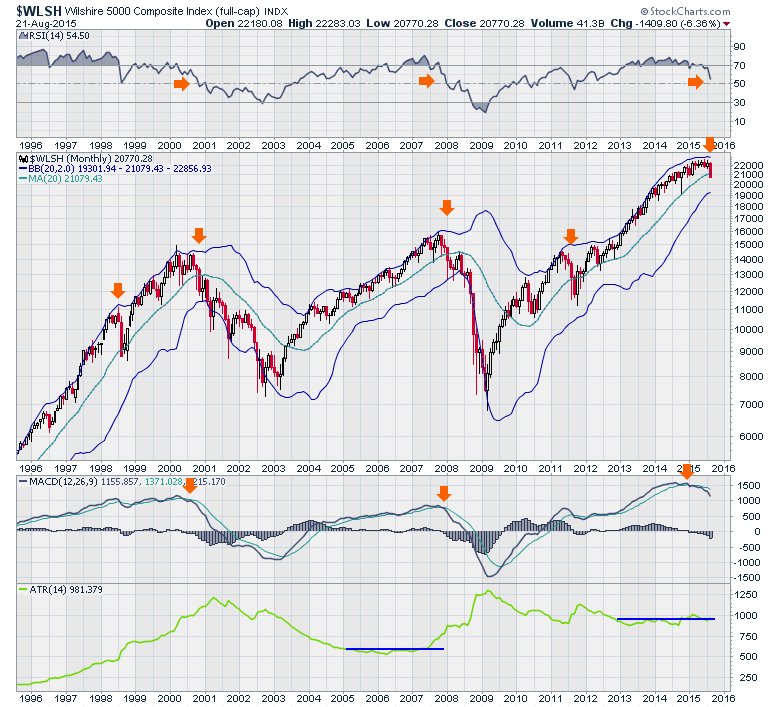
The Wilshire 5000 ($WLSH) is the broad composite. As you can see the MACD has had a negative slope for most of 2015. The ATR has been rising a little. Price will need to hold above the 20 MMA.
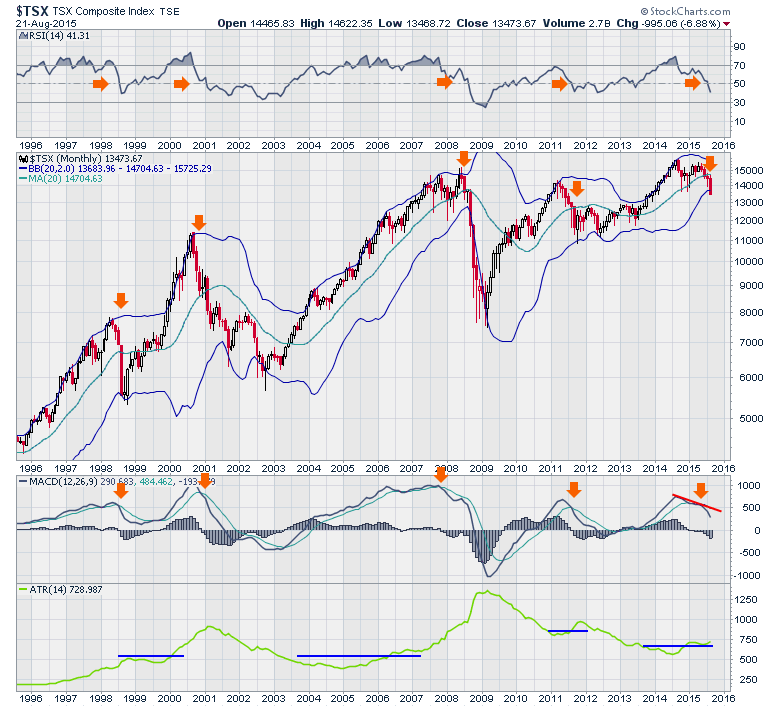
Going to Canada, $TSX is next. We can see all these signals are in gear.
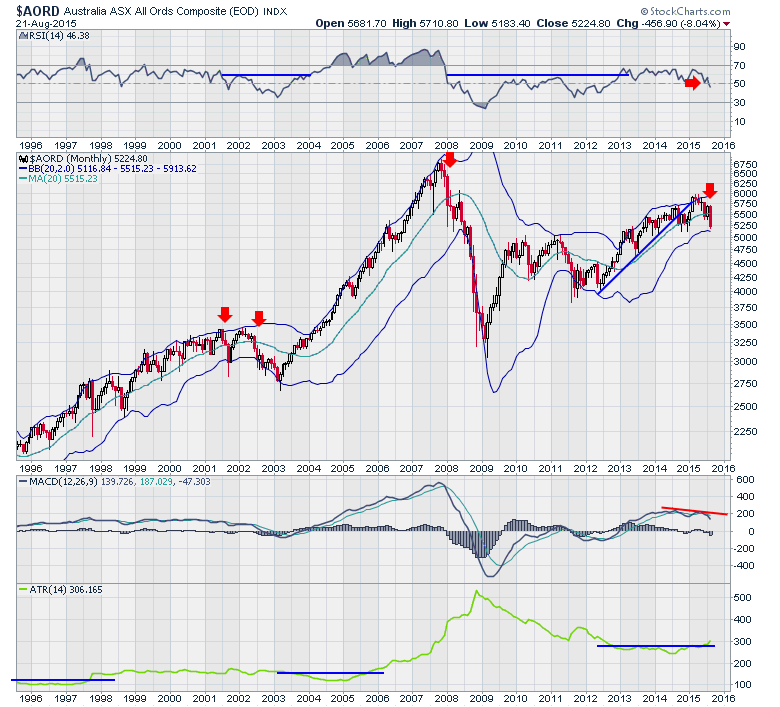
Let's move to some of the major markets in the world. Australia ($AORD) is a big commodity supplier.
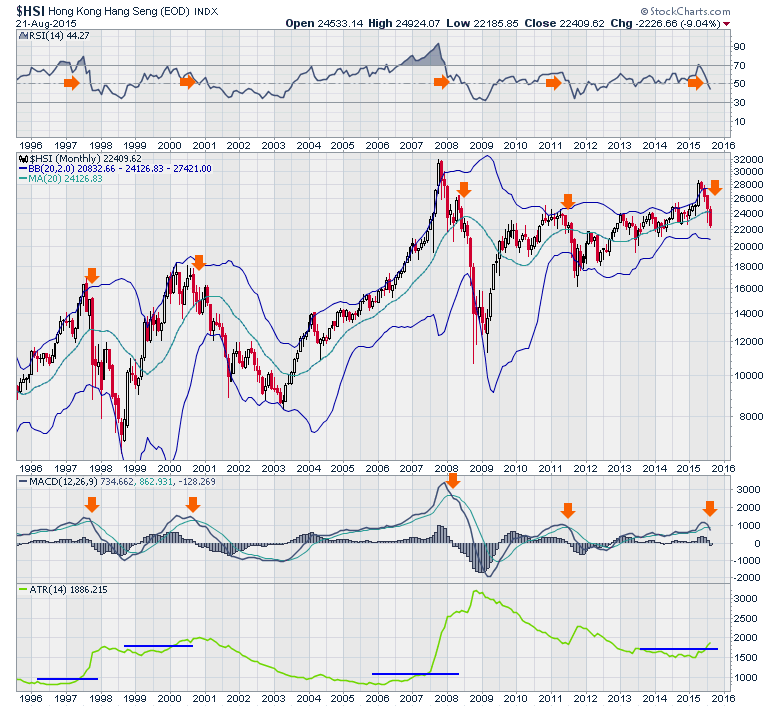
Here is the Hong Kong Hang Seng ($HSI).
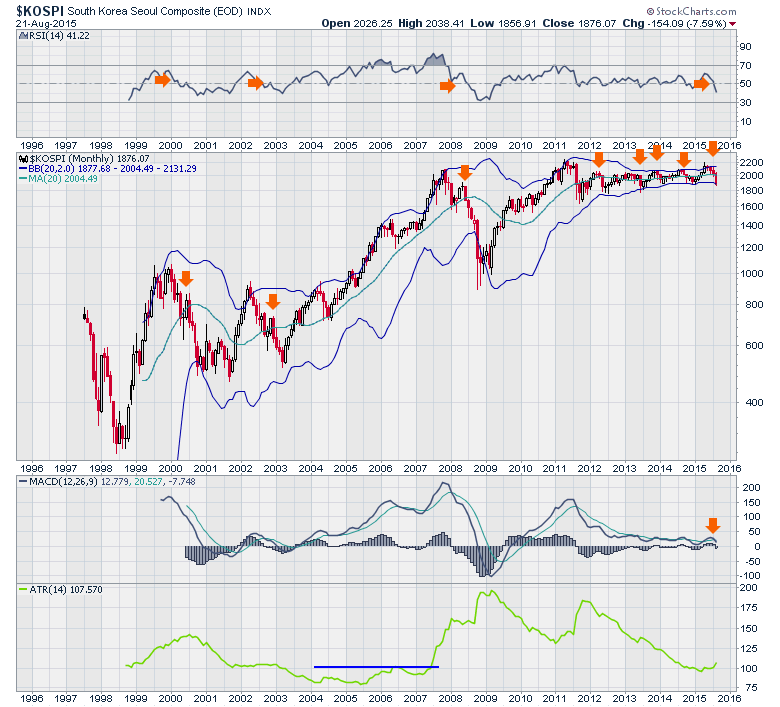
Here is the South Korean market ($KOSPI) that is under a bit of pressure with North Korea.
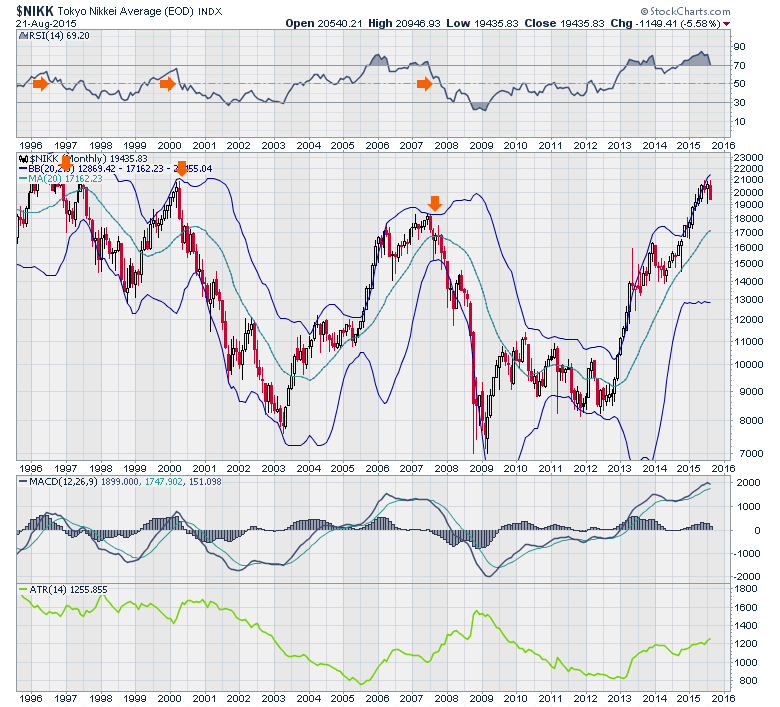
Here is Japan ($NIKK). The Japanese market does not look weak yet. The one rare part of the NIKKEI is it does not produce sideways tops. These seem to be more cliff style. The ATR seems meaningless on this one.
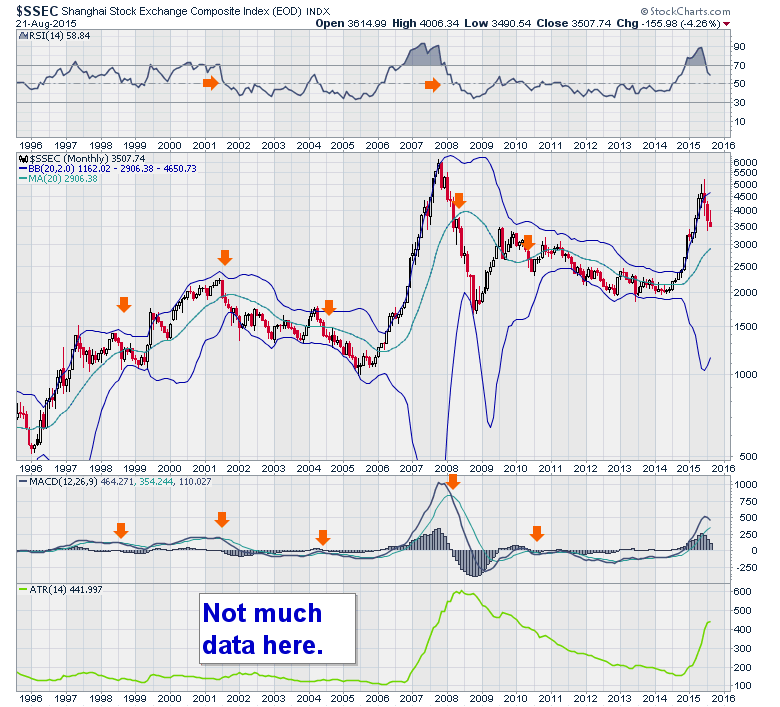
Looking at the Shanghai Composite ($SSEC), this has been quite a big mover in a parabolic rise. It is trying to stabilize now but sits above the 20 month.
I'll finish up in a separate article with Europe and the implications of this week's action. Call this one Part 1 of 2. We'll need to study the month end data closely so this gives us some extremely important levels to follow.
Good trading,
Greg Schnell, CMT.
