During The Canadian Technician 20160322 Webinar, I covered off some of the signals that were leaning to a new bull market. While I am still in bear camp mode, I did discuss some powerful charts that suggest a transition to a new bull market is very close.
The symptom of a bear market rally is that it seems to suck you in as you believe the worst is over. Just when you start to feel the trouble is over, it reverses into a downward slide. Then at the extreme lows, the pain is so real, you don't want to jump back in.
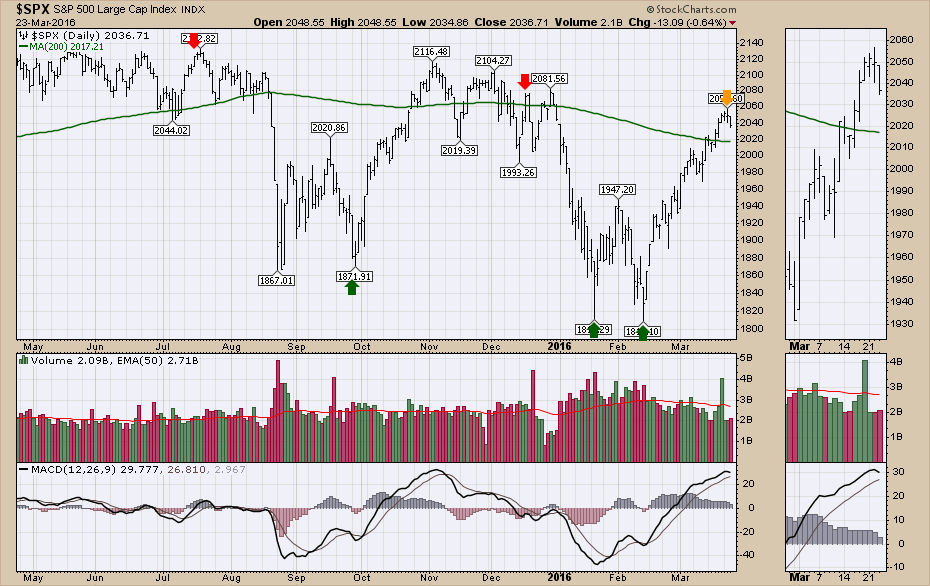
Let's look back at some of the moves in the market. Here is an article from July 14th marked by a red arrow. Why Technicians Are Worried And Fundamentalists Are Not. Then on October 3rd, we talked about the fundamental and technical approaches to the market. I covered this off in one of the most popular articles I have written. For fundamentalists, the bull market resumes. For technicians, this is a very important chapter. While the $SPX rallied into November, the $TSX rolled over a meager 5 days later in October and continued the bear market trend. The $SPX resumed a bear market trend in November without making new highs as well. The technicians were right to be concerned. Then in December, on the red arrow, an article about Three Topping Structures was pretty good timing.
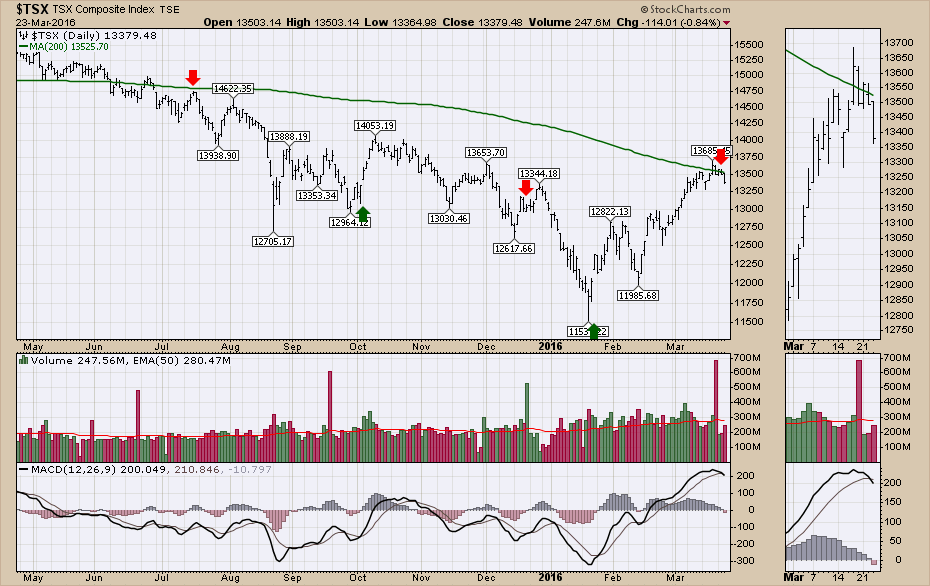
In January, the indicators had dropped to the levels where extreme lows are created. While there was a retest of the lows in February on the US indexes, the Canadian markets did not test those lows. You can see this in the two charts below. It was a nice time to enter the market from a profit perspective but difficult from an optimism perspective as the plummeting market rattled the nerves of the investor. In my own investing, I started putting capital to work in mid-January and had some moves whip me around. It is hard to get easy entries in volatile markets. Some of the industries that moved off their lows made substantial increases. A bear market condition of lower highs and lower lows suggested positioning in defensive sectors. The oversold areas of the market had substantial bounces for a trade. This brings us to the current yellow arrow.
Now in late March, both of these charts have rallied off the lows and have swung the indexes to the point that they could be starting new bull markets. My target for this rally was between 2020-2030 on the $SPX. On the $TSX, my target was 13000 with a potential of 13500 which was the 200 DMA. We have exceeded that.
 Here is the chart of the $TSX with the same time frame settings.
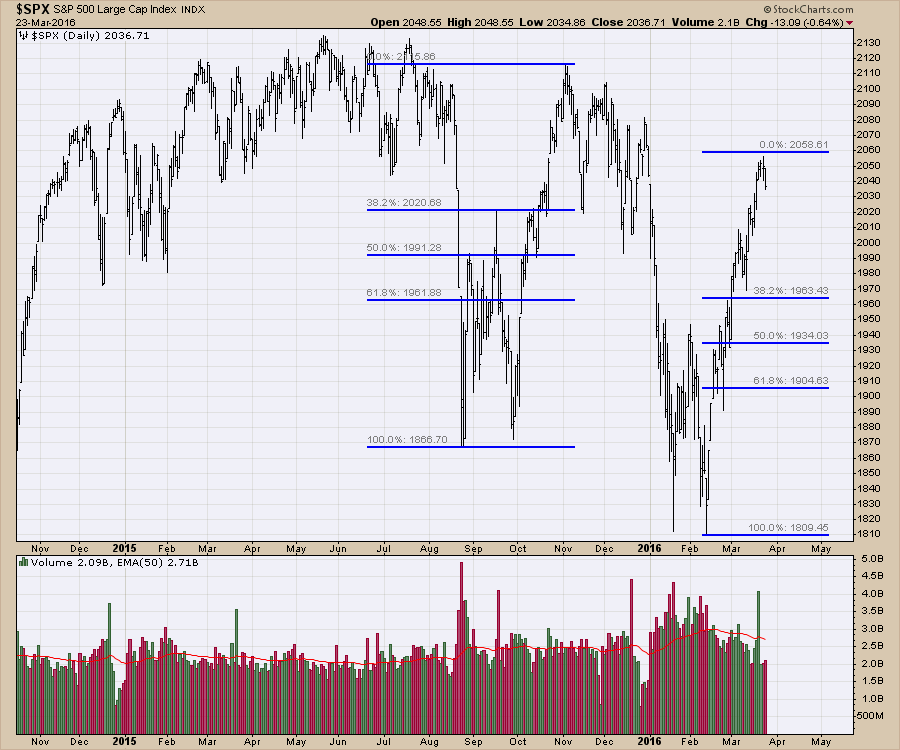
My primary premise is the bear trend we are in, remains until broken. At this point, that premise is being tested. Last week, I posted the chart below before the price had extended to Tuesday's high as a potential ceiling. The two Fibonacci measurements are identical. The March move in the $SPX has moved the same amount as the $SPX did off the October lows. The fact that the $SPX and the $TSX drifted lower all day and failed to mount any serious rally Wednesday on no news, suggests to me we might have found a near term top. Regular followers will be aware of the Fed day, Options Expiration Day and Monday's crude contract as dates for potential resistance. Thursday's rally after Fed day closed at 2040. The market level before the Fed announcement was 2010. We are now trading in the range of the Fed move at 2036.
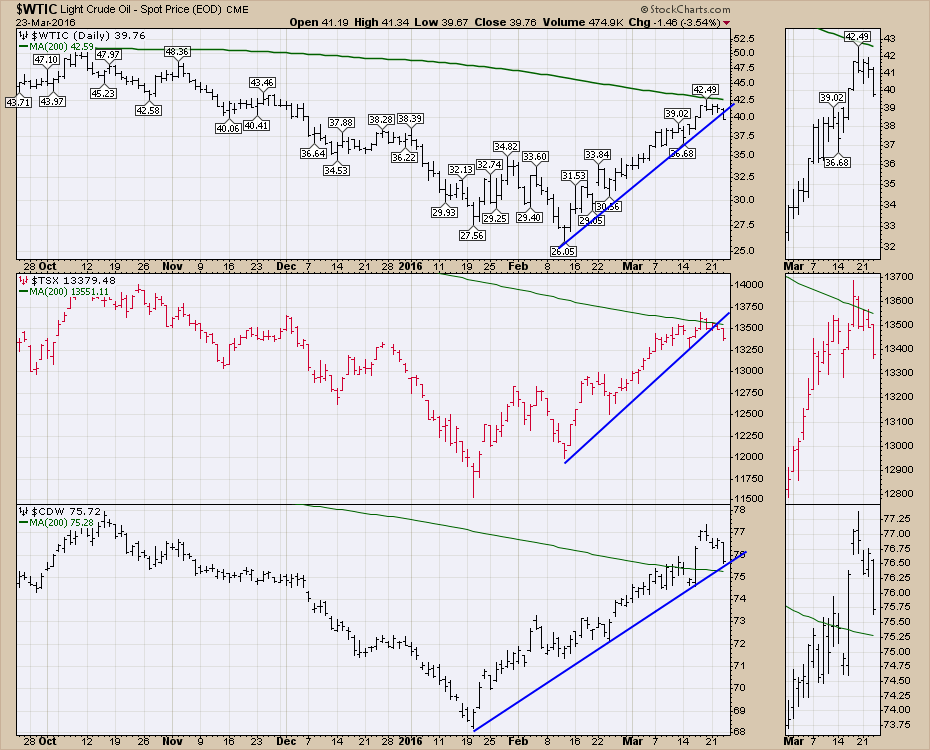
 The oil chart ($WTIC) has topped out on Friday's Options Expiration Day (OED). We have been monitoring the move in oil suggesting that the top may well occur on OED or on Monday when the futures contract rolled to the May contract. We can see that the $WTIC plot and the $TSX plot tested their 200 DMA's on Friday and have retreated since then. When we are only a few days from this high, it is hard to know if this will be the top in the rally. It would not be a surprise to look back from a future date and having the benefit of hindsight, recognize a bear market rally topped out at the 200 DMA. This is a really important place to look for a turn, and I would suggest that caution should be exercised until this resistance is broken.
 The $TSX high-low indicator is in a very interesting place. The chart ($TOHL) shows that it recently exceeded the 50 level. The 50 level is a level that I noticed seems to mark resistance during bear markets for the $TSX. Notice in 2008, even with the oil run to all-time highs of $148, the net new highs barely exceeded 50. So now, we have the indicator recently exceeding 50. Is this the same as the 2008 time frame, which was a bear market rally, or are we starting to make a new bull market like the one shown by the green arrow in 2009?
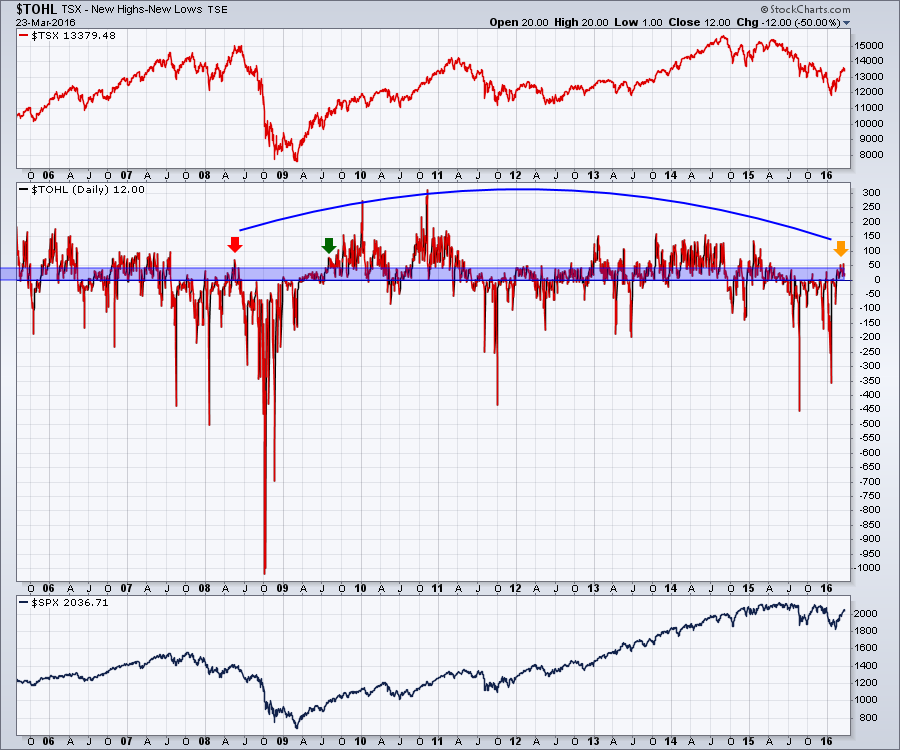 In my opinion, the bear market is still intact, as we are still making lower lows and have not made higher highs in the US or Canada. However, this is when we should be acutely aware of the potential for a new bull market.
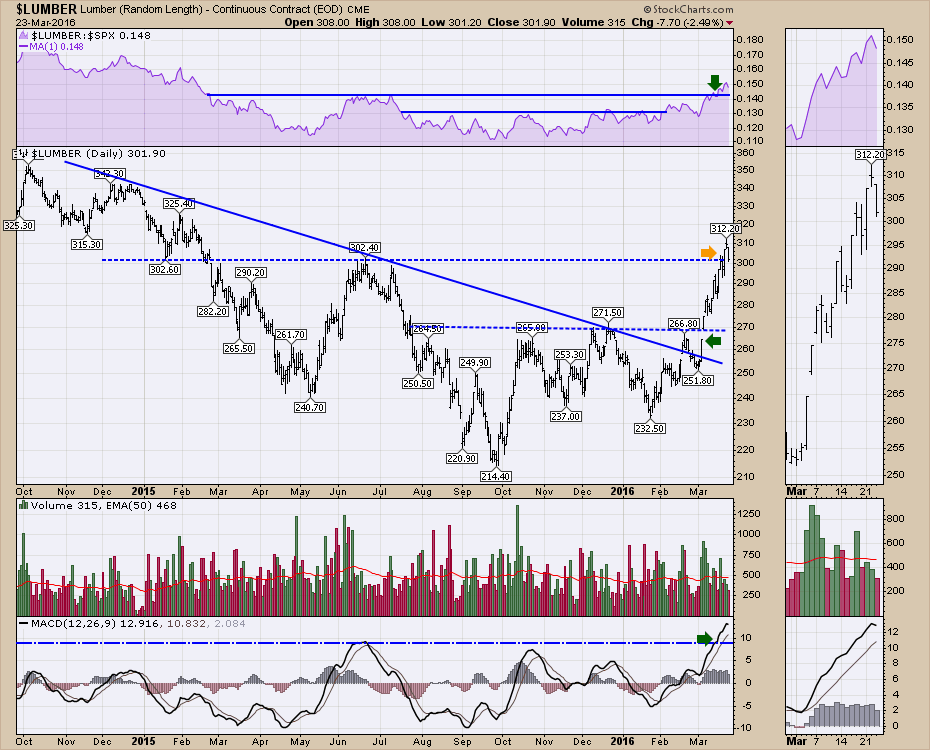
I looked specifically at $LUMBER as it has been moving nicely. One of the major commitment points on $LUMBER is that it must hold over 300. Wednesday's close was $301.90 after being at $312 the day before. This $10 drop is concerning the day after making a new 52 week high. If this breaks down, $LUMBER could easily test $270. A false breakout usually leads to an above average move in the other direction.
 Once again, to watch the webinar archive, follow the link. The Canadian Technician 20160322.
I will be presenting a Commodities Countdown Webinar 20160324 at 5 EST. Lots of the charts have interesting twists this week. From the precious metals pullback to the outlook for oil, we'll try to evaluate the different outcomes and possible positioning. Follow me on twitter @schnellinvestor.
To respond to the question in the title, (Now That Fundamental Investors Are So Bullish, Is This Another Pivot Point For Technicians?) where are we at? I think we are at a major pivot point for technicians. For fundamental investors, they are probably not aware of the major resistance and the potential to make a dive lower. From my perspective, we could be entering some rocky trading. Worst case scenario, a resumption of the big bear trend which is still very much on the table. Best case scenario, we breakout through resistance and go on to make new highs.
Good trading,
Greg Schnell, CMT,MFTA.
