This is part three of a three-part article on the currencies. Click here to link to the first article on the $USD. Here is the link to part 2: Euro and Yen. For this article, we'll review the Aussie, the Loonie, and the Pound.
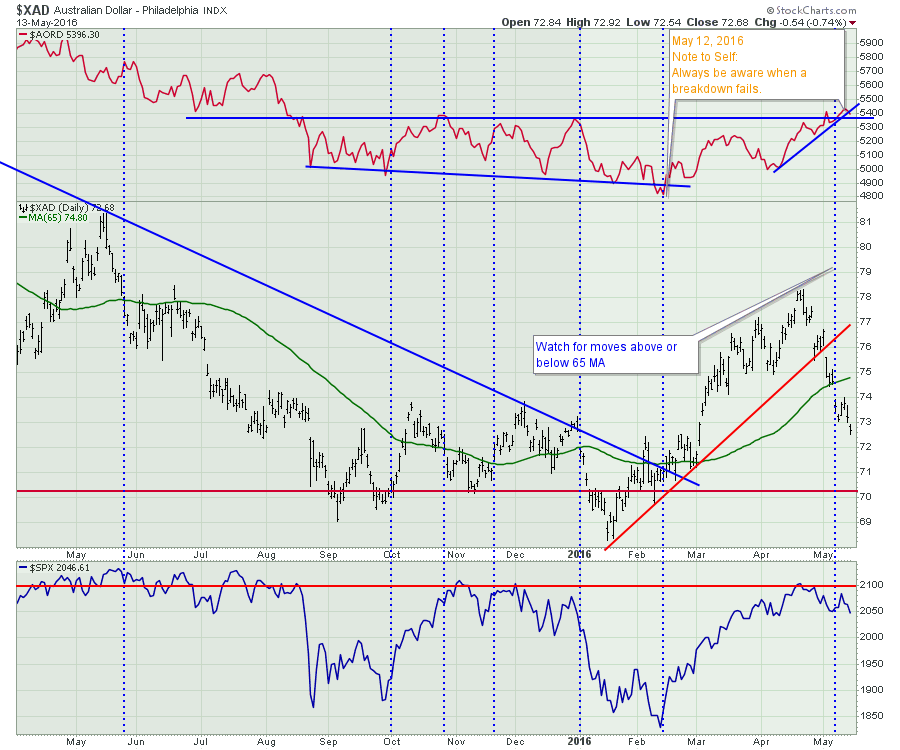
First, let's start down under. Here is the daily for the Australian Dollar (nicknamed the Aussie - $XAD). I like to think of Australia as the commodity supplier to the Far East. We can see a pretty good correlation between the Aussie above the 65-period MA and a rising Australian Stock Market. Notice the failed break down (it reversed and went back up) in January on the currency marked an important change in trend. This also coincided with the bottom in crude oil ($BRENT, $WTIC a week later). The Aussie dollar reversal was a few weeks after $GOLD broke out. It is very clear to me that the Aussie Dollar is breaking down after going through the uptrend line and breaking below the 65 MA. Commodity-owners should be cautious here.
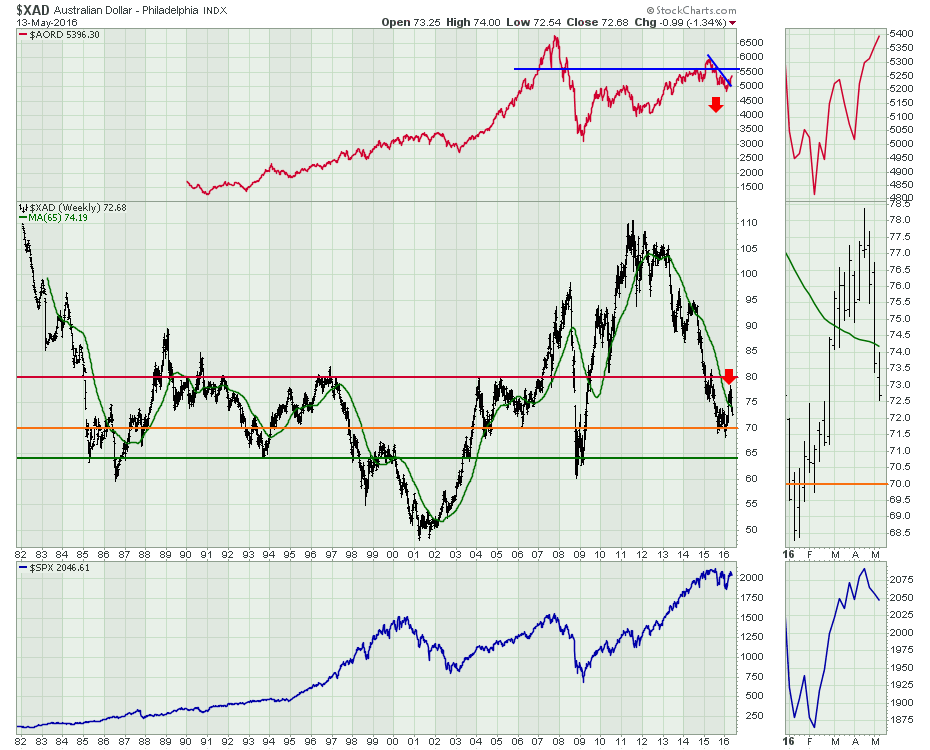
Looking at the big picture on the Aussie, we see an important level nearby. 80 is an important support/resistance and we failed there. Looking at the zoom box, it has been an expeditious retreat the last few weeks as we lost 6 cents. Now we are back below the 65-week MA and I would expect the weakness to spread to the $AORD index soon. If we are going to be in a long-term commodity bull market, this chart will have to be going up, not down. The area between 70-80 is where the Aussie has been trading for 20 of the last 31 years. It would be fair to expand that range down to the 64 level. We'll see if the chart tests 64 in the near future.
 The British Pound has been taking a pounding. We sent Mark Carney over there, but it has not stabilized the Pound. Let's look short-term first as we have the British Referendum on the relationship with the Eurozone coming up June 23rd.
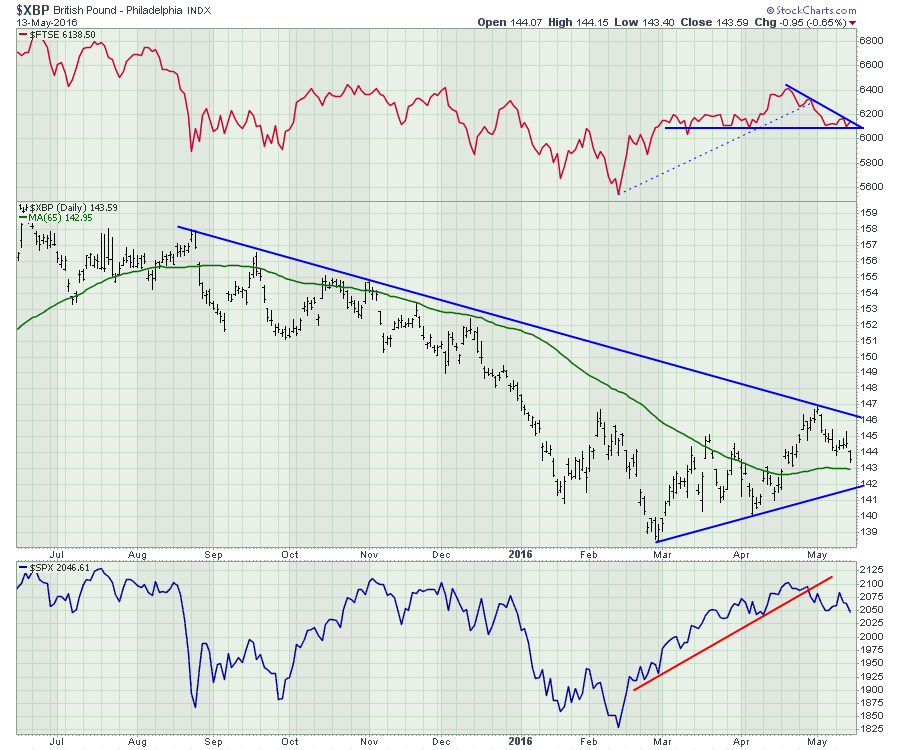
Well, the trend is top left to bottom right. The recent consolidation around 144 is interesting, but the Pound looks to be faltering. The $FTSE equity index in London looks similar to the US. Making lower highs and lower lows a month later, the equity market looks set to break to three-month lows. There is uncertainty in the election according to the Guardian Poll (link here) as it is too close to call. As long as that uncertainty remains, we probably won't have a decision on which way the Pound should float. Currently, the trend is south, and the 6000 level is meaningfully important for the $FTSE.
 For the bigger picture on the Great Britain Pound, the 140 level is very important. We can see that this marks the area of the lows for 30 years. If the pound breaks down, 135 is the final line in the sand.
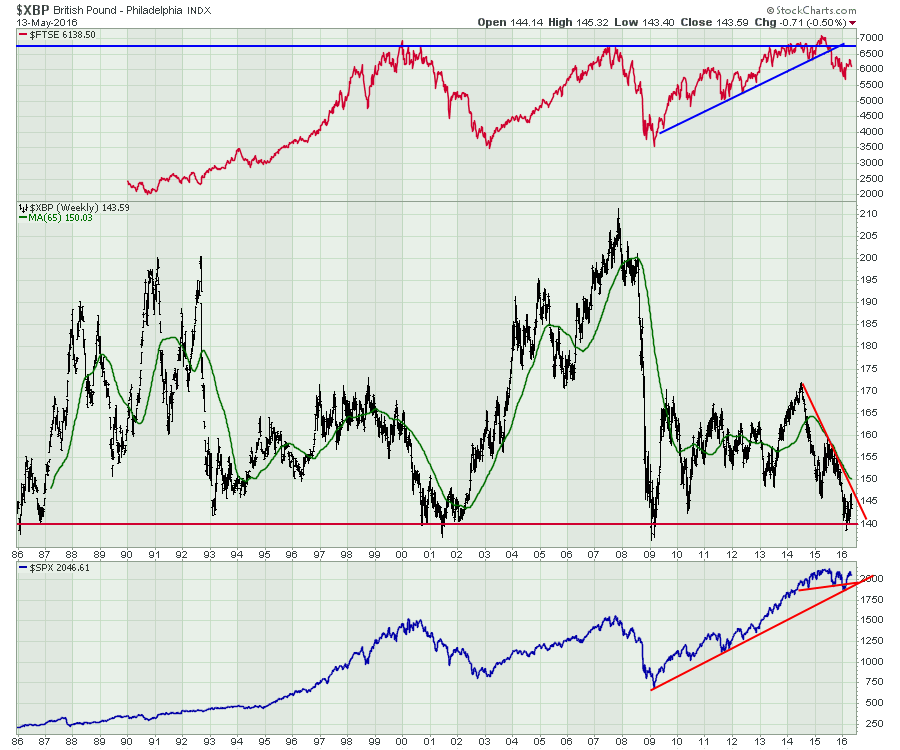 For the Pound, the vote is a big deal. 140 should hold. Because numerous miners are listed on the $FTSE, I have included it in the Commodities currencies in this three part series. I don't think the miners matter as much as the voters currently, as the currency has been losing weight for a while. $XBP could not rally like the Aussie in the current commodities bounce.
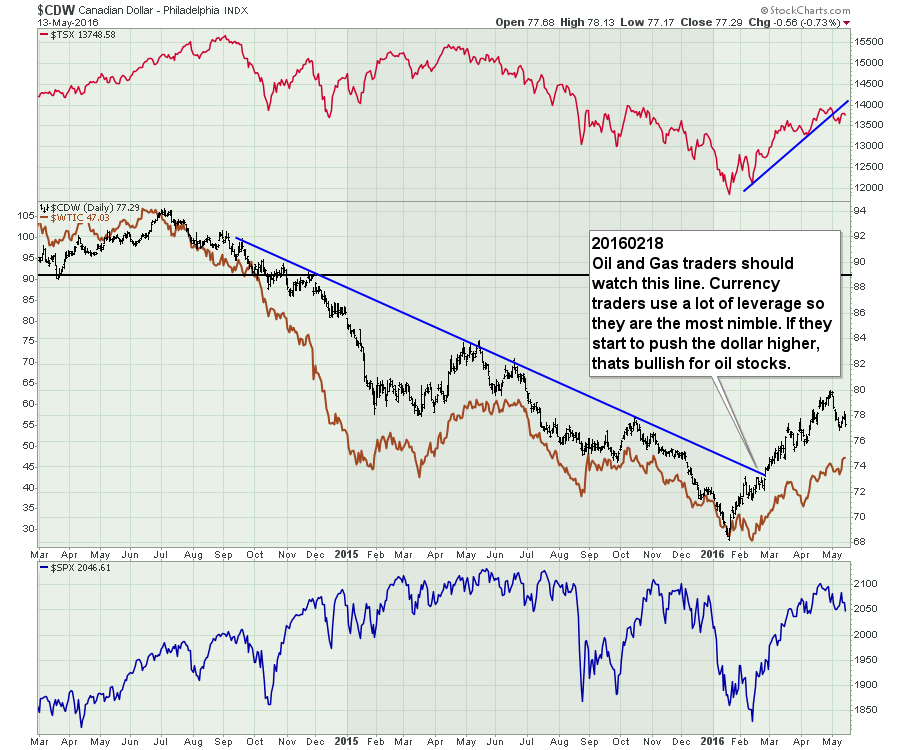
The last currency for this series of articles is the Canadian Loonie. A $1 coin has a loon, a bird, on the back so the Canadian Currency enjoys a nickname of a Loonie. We can see that the price of oil and the Canadian Dollar are linked. This is the chart that we have been reviewing during the webinars each week.
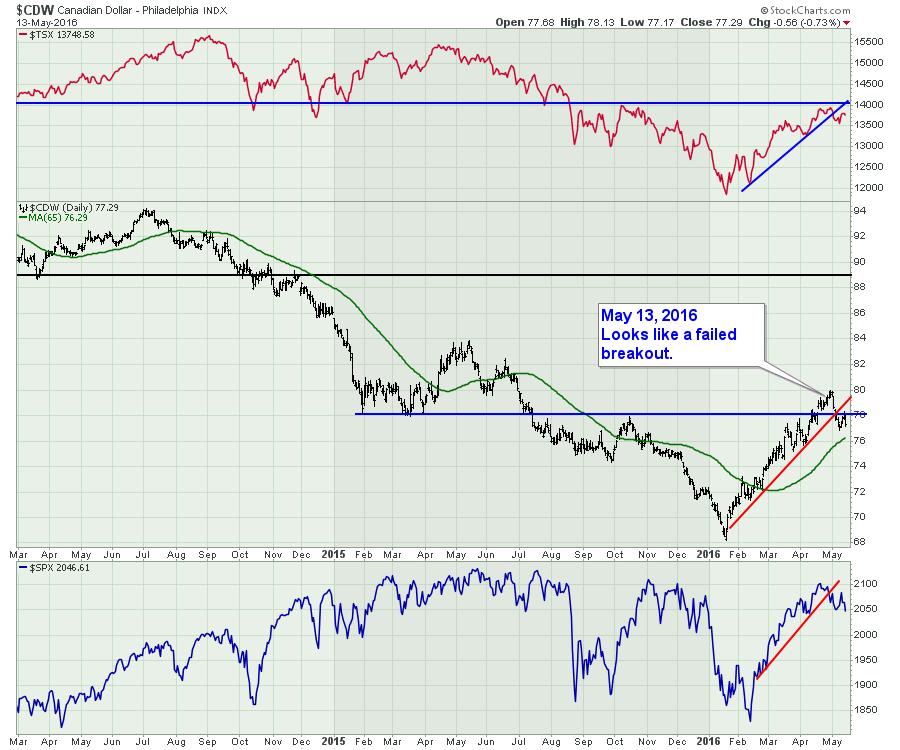
 So let's remove the price of oil, and mark up the chart with the usual annotations. On the currency, we have a failed breakout so far at 78. With the trendline break at the intersection of the two trends in early May 2016, it means even more. We can see 14000 is very big resistance for the Canadian market ($TSX).
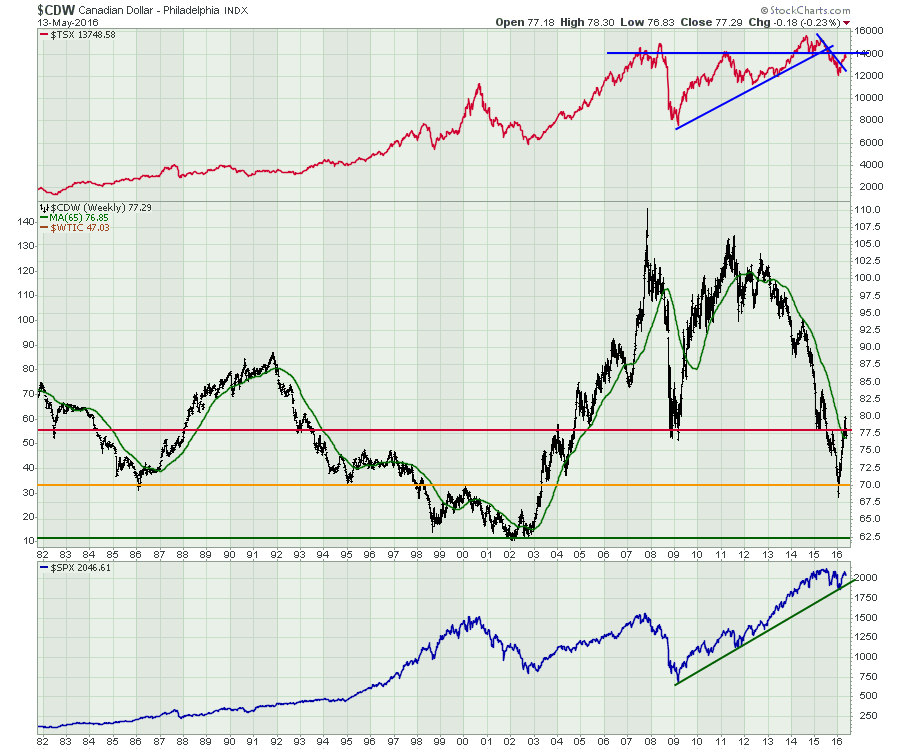
 Moving to the long chart, the Canadian Dollar has similar traits to the Aussie. It is in the lower part of the long-term range, where it has spent 13 of the last 32 years. With the recent failed breakout above 80, it looks like we are going to spend more time there. The 65-week MA marked this week's low. In the top plot, you can see how important the 14000 level is for the $TSX. If the Canadian Dollar can get back above 78 and hold it for a month, we are probably moving into a new trading zone. If it follows the trend of the Aussie, which is a pretty similar story, we are going lower on the currency.
 Now that we have analysed 6 currencies, what are the main takeaways?
Starting with the US Dollar,
I think there is potential for a ballistic move out of the last 18 months consolidation. The 92 level on $USD is a powerful pivot either way. The Pound and the Euro look weak to the dollar, and the Australian and Canadian dollars are back into an area where they have spent a lot of time over the years. The Yen is a bit of a surprise. It shows strength against the US Dollar, but it is near major resistance at 95. Wrapping it up, there is no reason to expect the $USD has topped out. Everything else looks stuck under major resistance levels. If the $USD does break down below 92, it should send all 5 currencies meaningfully higher as they all break major resistance together. Usually, when you have a tsunami of resistance break together, it is a meaningful change.
So what does that mean for your investments? A ballistic US Dollar would imply caution towards industrial and precious metals. The likelihood that oil has to make a new low with a rising dollar does not match with history after already plummeting 75% or more. A falling US Dollar would probably reallocate money into other currencies so the EFA and EEM ETF's might show more relative strength.
In case you missed the Commodity Countdown Webinar 2016-05-12 that led to this series of articles, click on the link. I have a presentation to the Vancouver Chapter of the CSTA on May 18th, 2016. If you are interested, click here. Victoria/Vancouver meeting 2016-10-18. You can also follow me on twitter @Schnellinvestor. Sometimes email is the best way to receive these articles. Feel free to click on the Yes button to get this blog direct into your email when new articles arrive. You can check out The Canadian Technician 2016-05-17 Webinar by clicking on the link to register! We can definitely cover off more ideas about this currency situation. As always, feel free to share articles with family and friends who might be interested.
Good trading,
Greg Schnell, CMT, MFTA
