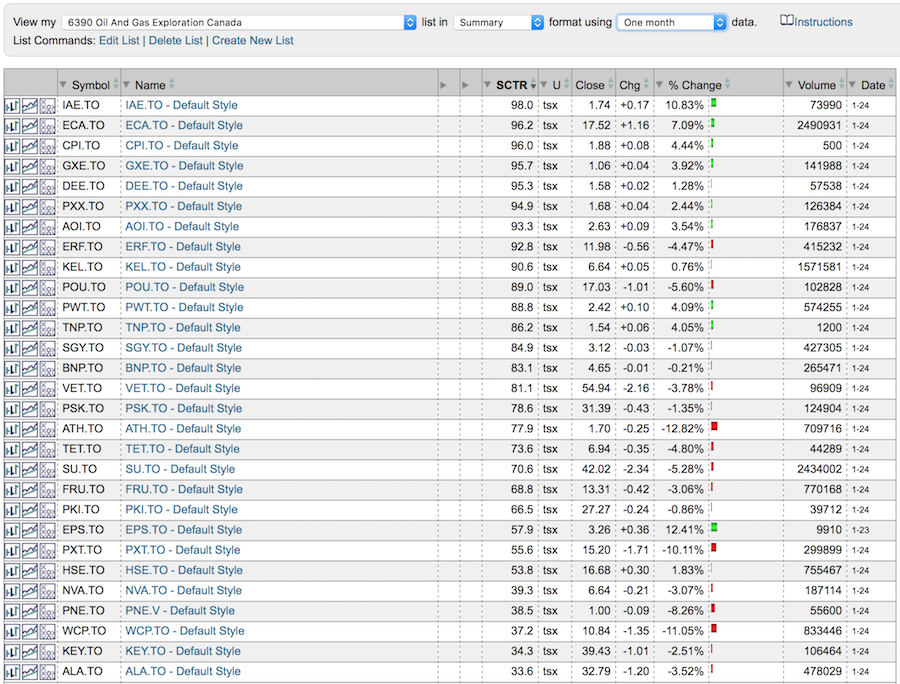
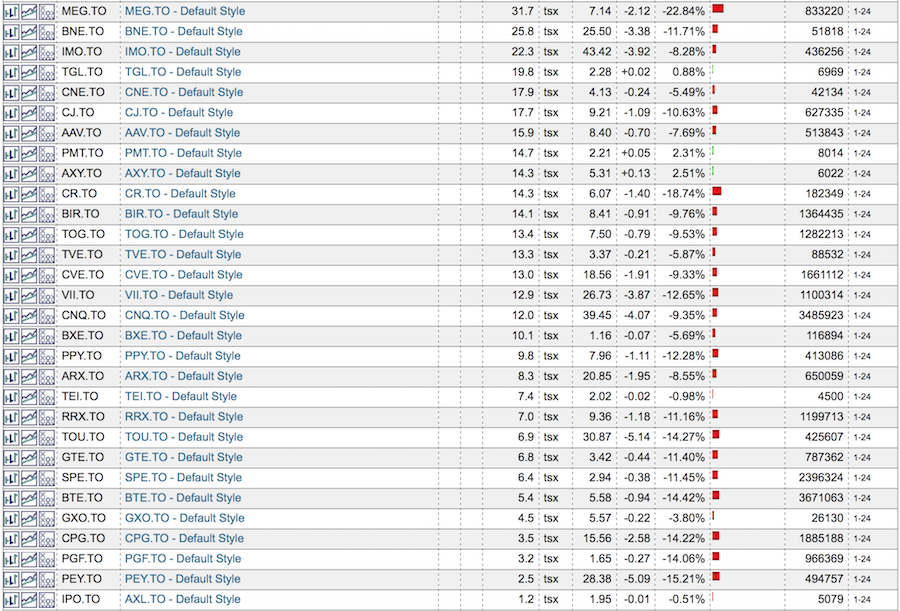
The Canadian Oil and Gas Exploration stocks have fallen off the luster list. With only 17 of them above 75% (top Quartile) on the SCTR ranking, it is pretty dismal. This list only looks at TSX listings, above $1. This list is sorted based on the StockCharts Technical Ranking (SCTR) which ranks a stocks price movement compared to everything on the $TSX over the last 200 trading days. A stock with an SCTR of 80% is performing better than 80% of the stocks in the $TSX. I have also set the % Change indicator to one month. As you can see, even though oil is holding up around $50, these stocks are falling away for the most part. Natural Gas has also drifted back from the highs but Encana is holding up well.
 For the oil services industry group, it is not quite as bleek. This list is also sorted based on the StockCharts Technical Ranking (SCTR) which ranks a company's price action compared to everything on the $TSX over the last 200 trading days.
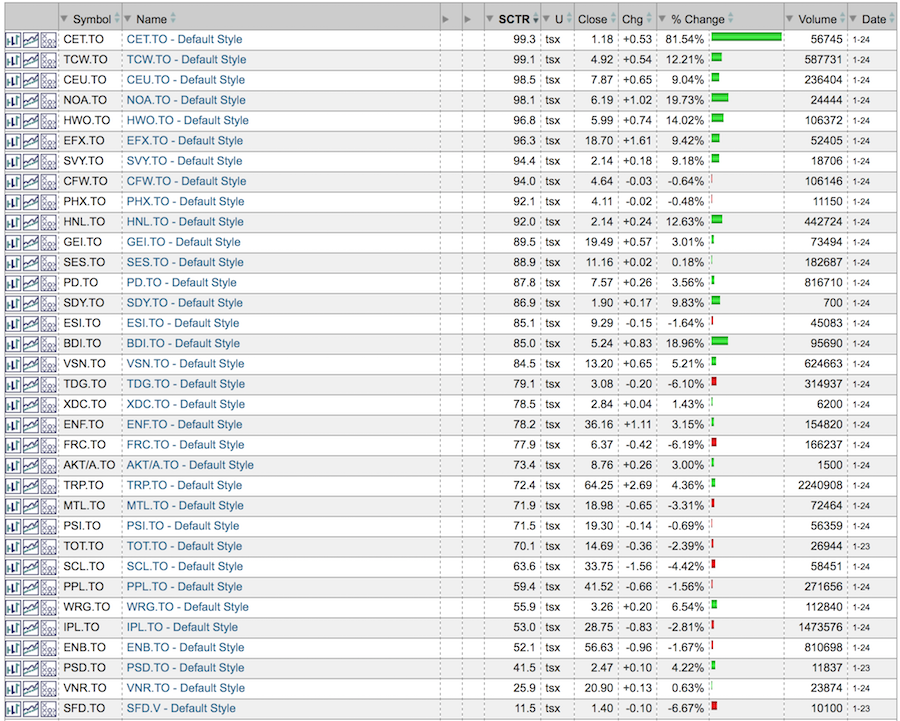 Currently, it is safer to be in the Services group than in the E & P group as 21 of 34 are still in the top 25% of the market for price action. Part of this may be because of the forward hedging which limits the upside of the Exploration stocks.
I will be presenting three webinars this week. The Canadian Technician Webinar on Tuesday, The Commodities Countdown Webinar on Thursday and the Saturday morning kickoff to Chart Summit 2017 as part of a presentation with 17 other technicians.
- The Canadian Technician Webinar 2017-01-24
- The Commodities Countdown Webinar 2017-01-26
- Chart Summit Webinar 2017-01-28. Registering through this link gets you into 18 presentations at no cost.
My Educational Segment:
For the educational section of my blog, today seems to be lining up as the perfect day to talk about the StockCharts.com Bullish Percent Indexes (BPI). My Bullish Percent Index chart was recently published as the Market Technician's Association "Chart-Of-The-Month" article. These are solid charts that really help see the underlying strength of the market. By the end of this article, I think you'll be a huge fan of BPI's to help protect your investments.
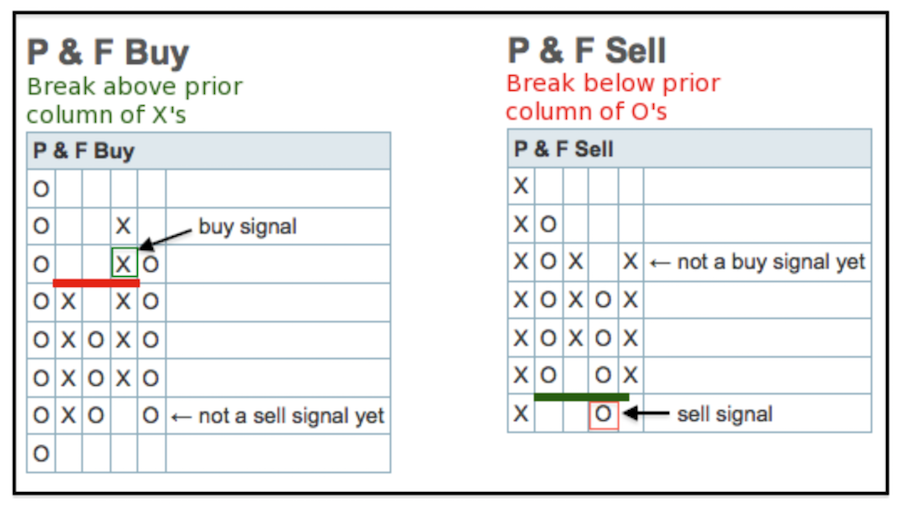
First of all, background information on the BPI calculation can be found here. Bullish Percent Index. The Bullish Percent Index tells you what percentage of stocks in a group are on a buy signal. If they are not on a buy signal, they are on a sell signal. When the market is raging forward, lots of stocks participate. As the market gets weaker, more and more stocks go onto a sell signal until there is not enough breadth to hold the market up.
What is key to understand is that Bullish Percent Charts don't flip from buy to sell easily. They stay on a buy signal until a lower low is made. They stay on a sell signal until a higher high is made. You need a group of stocks to work with like the Toronto Stock Exchange ($BPTSE) or US Energy stocks ($BPENER) as examples. This allows you to understand the strength of broad spectrum of stocks within a group. When everything is rising, it is nice to be part of the big momentum.
 You can use line charts to display the Bullish Percent Index information as I will demonstrate below.
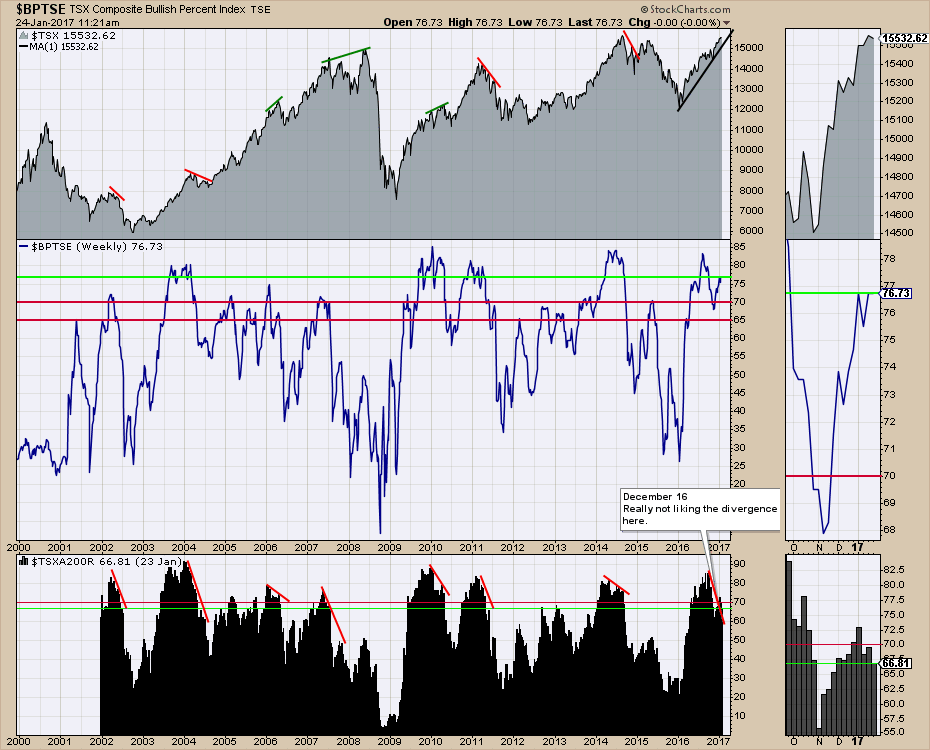
On the center panel below, the most recent thrust since November has had fewer stocks participating so the breadth is getting narrower but is still in a bullish range. That does not mean sell. The fact that the market is holding above the two red lines I have put on the chart suggests the market still has broad participation. The other thing about the Bullish percent indexes is that the spike lows help you invest when everything is out of favor. So when everyone is getting grouchy about the market, this alerts you that you are near a level that the market historically bounces from. This helps make you aware of likely areas for a rally to start. The January 2016 lows were a fantastic place to start getting long the market.
I like to pair my Bullish Percent Index charts with another chart, the percentage of stocks above the 200 Daily Moving Average ($TSXA200R) in the lower panel. As you can see, the percentage of stocks above the 200 DMA is lower than it was in the summer. This is concerning as the market is higher and we had a lot of euphoria around the US election but not as much participation in the market. Looking left on the chart, the 70% level is very important. When the market has that level of participation, it is usually ok. However, failure to hold above the 200 DMA starts a relatively quick drop in the number of stocks participating. If the market starts to lose strength, we would expect this 200 DMA indicator to start weakening first as weak stocks fall below the 200 DMA. As the $TSXA200R weakens and the Bullish Percent Index holds up, this gives investors advance notice to some potential weakness so they can protect profits gained in the recent market push higher.
 As a StockCharts.com member, you can keep these charts in a chartlist for yourself and you can examine the market health with this custom indicator provided by StockCharts.com. These unique indicators and unique display methods are designed to help our members make money and keep profits in the market.
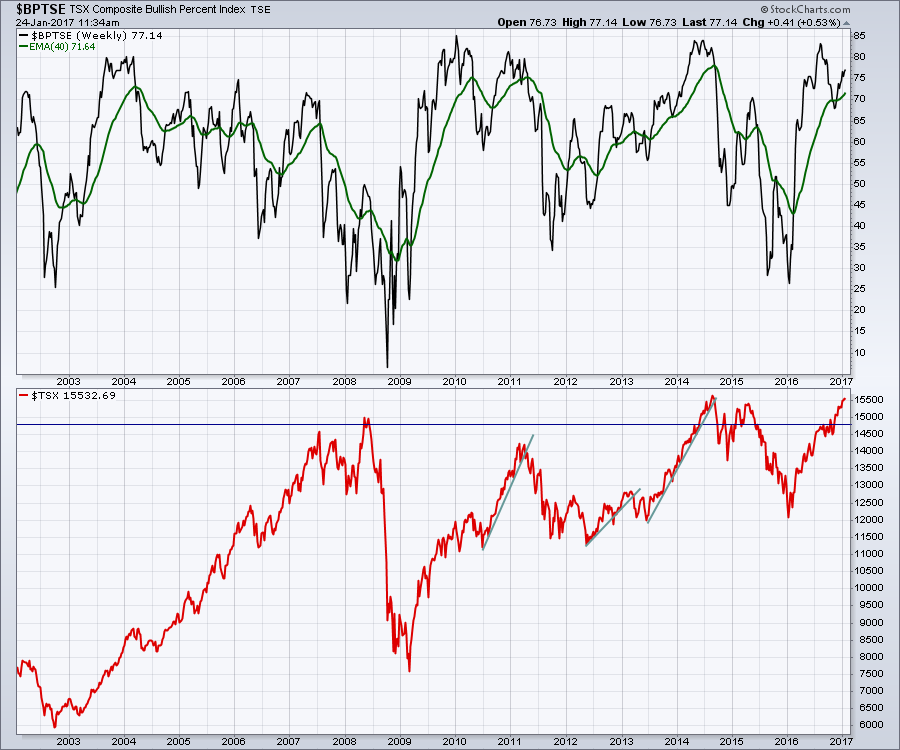
Here is another simple look at the Canadian $TSX using the $BPI indicator. Staying long the market when the Indicator is above the 40 WMA line in green is bullish. In this case, look at how the $BPTSE behaves after lower highs from a really high level. It usually pulls the market back signficantly. We have not seen that happen yet, but it is something to be aware of.
 At StockCharts.com, everything we do is to help you understand the markets. I want to thank you for subscribing to the StockCharts service to empower yourself in the market to make and keep profits.
We have millions of page hits every month from investors who are not aware of StockCharts value proposition for subscribers. I've made it a goal this year to at least make every subscriber and visiting investor understand some of that unique value.
Let me make an offer that I have not done before. I will personally send every new member to StockCharts.com who joined in January a direct link with instructions for saving the chart complete with my annotations. Those existing members who would like to have this chart in their chartlist, I will make it really easy for them as well. If you overwhelm me I'll send out a Member's only email with the link! The link will only work if you are a member or sign up for our 10 day free trial by clicking on this link. PS. Don't forget to use the Coupon code BESTCHARTS for 1/2 price on the first month! My email is gregs -at- stockcharts.com. The next component to this is that you will be able to follow along as this chart changes through my blog where I'll share my interpretation of the information on the chart. To keep up with the updates, please click the Notify me button below this article.
So four things to do:
Register for all of the upcoming webinars:
- The Canadian Technician Webinar 2017-01-24
- The Commodities Countdown Webinar 2017-01-26
- Chart Summit Webinar 2017-01-28. Registering through this link gets you into 18 presentations at no cost. Arthur Hill will present at this one as well.
Lastly, send me an email to get all 20 of my BPI charts into your StockCharts.com account as a chartlist. The only criteria is that it has to be the email you subscribe to StockCharts.com with. Easy enough. Send me an email using the @sign > gregs -at- stockcharts.com with the Subject line: Greg's 20 BPI charts please.
Yes, you can share this email with your family and friends.
Good trading,
Greg Schnell, CMT, MFTA
