The industrial metals stocks have ratcheted their way to the top of the SCTR rankings. They appear to be continuing to accelerate. The Capped Materials ETF (XMA.TO) in Canada broke out to 3-month highs Tuesday. The Relative Strength Ratio in purple is just about at 3-month highs as well.
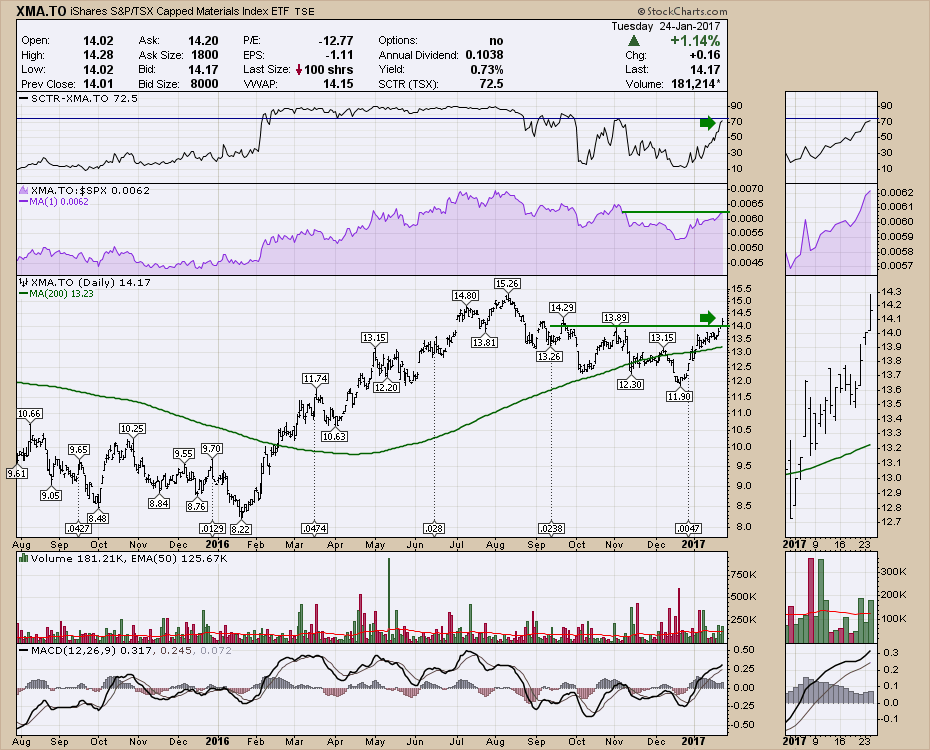 The MACD has surged into positive territory after spending 4 months below the zero line. This group has room to run and this chart has some resistance 10% higher than this level.
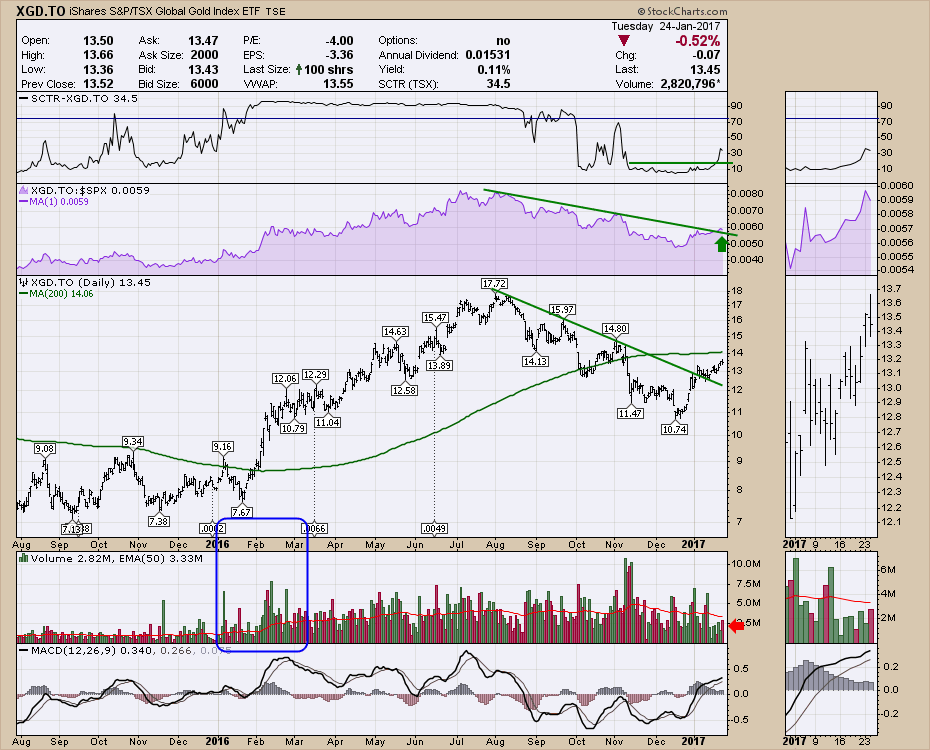
The Gold stocks continue to work higher, begrudgingly it would seem. They seem to close most days in the middle of the range. Here is the XGD.TO chart representing the global gold miners. Notice how light the volume has been even though gold has worked its way higher all of January. Some of that same look happened last year before the February ramp.
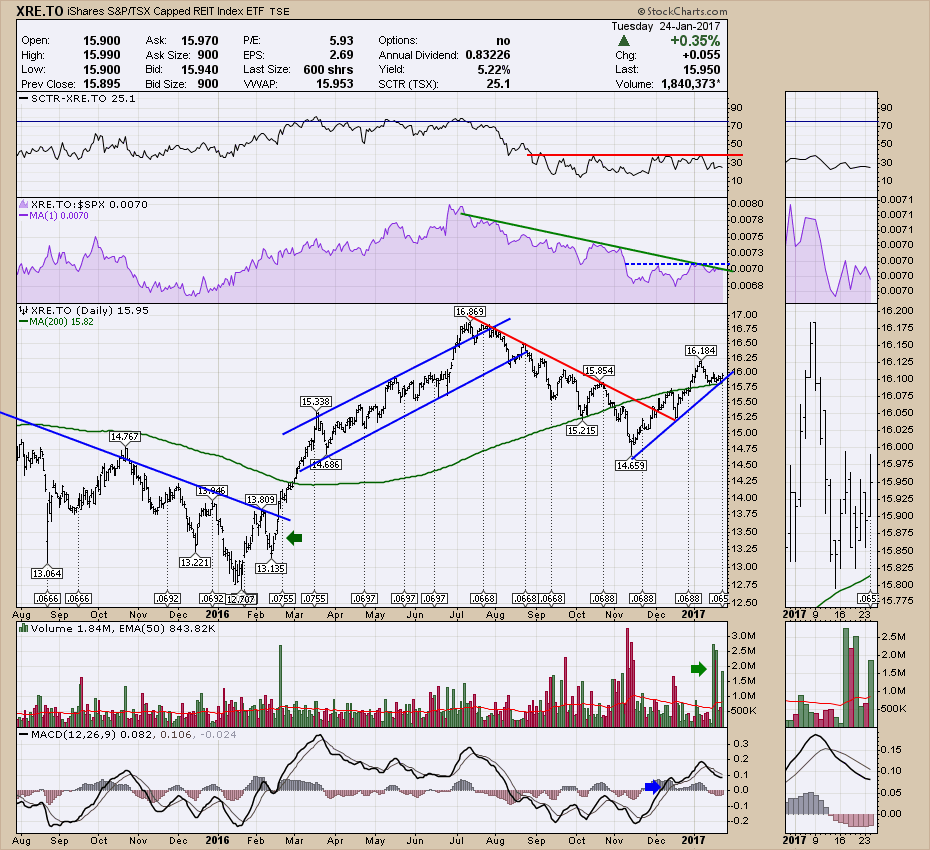
 I spent some time talking about the defensive sectors for yield-oriented investors on the webinar. The base on the Capped REIT ETF (XRE.TO) looks complete. The price bars are oscillating with higher highs and higher lows. The MACD is in positive territory and the volume is coming in a big way. It wouldn't take much to get the Relative Strength to new three month highs and breaking the 7-month downtrend. You'll need to watch for a signal but this could be setting up. Put a nice yield of 5.22% in your pocket. That's pretty nice on a chart making higher highs and higher lows since November.
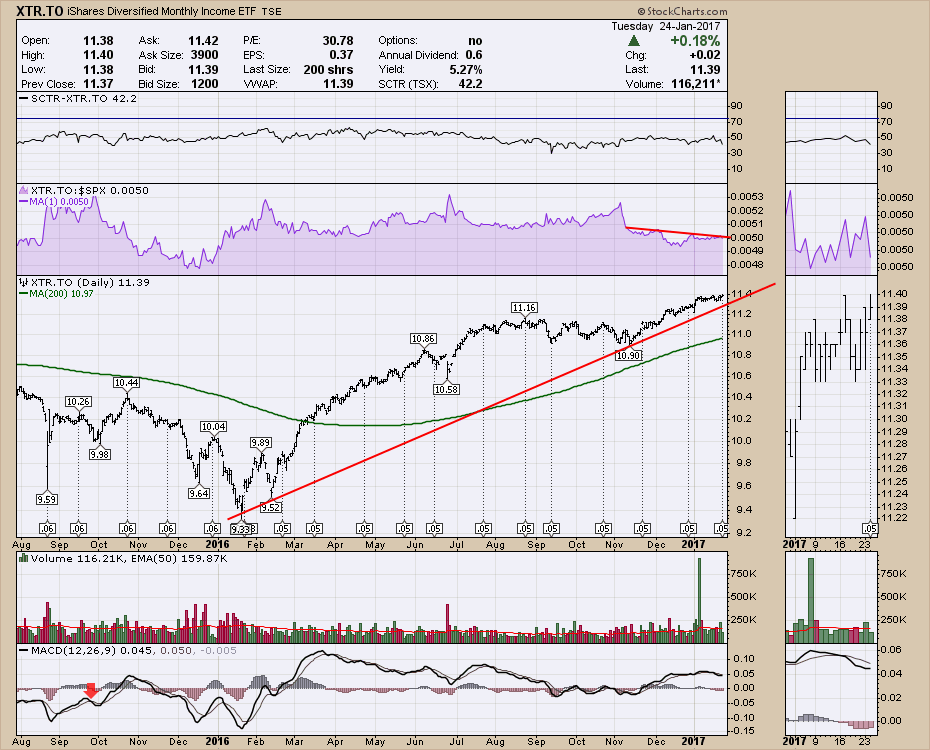
 The Income Trusts (XTR.TO) don't look quite as rosy on the Relative Strength in purple, but the yield is 5.27% which is just as huge as the REITs and the chart seems to be centipeding its way to new highs continuously.
 I spent more time on the webinar with some tips and suggestions for getting more out of the website for our members. I covered off sharing chartlists with friends, working through a simple scan, saving chartlists with a sort order,using the Rank By coding in the scan, and manipulating SCTR listings.
The Canadian Technician LIVE! with Greg Schnell - 2017-01-24 17:00 from StockCharts.com on Vimeo.
My Educational segment:
So if you are interested in a simple scan to put the top stocks in front of you, this is the code I use and then just work through them one at a time. It continuously throws great ideas at you. You can copy and paste this into your advanced scan template.
[Country is Canada] and [sma(20,volume) > 100000] and [SCTR.tsx >75]
rank by [SCTR]
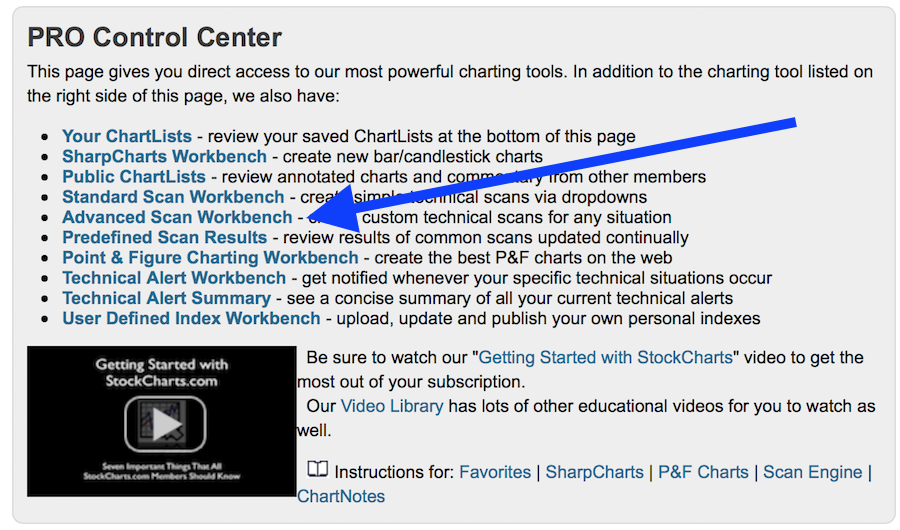
You can find the Advanced Scan Workbench link on the "Members" tab.
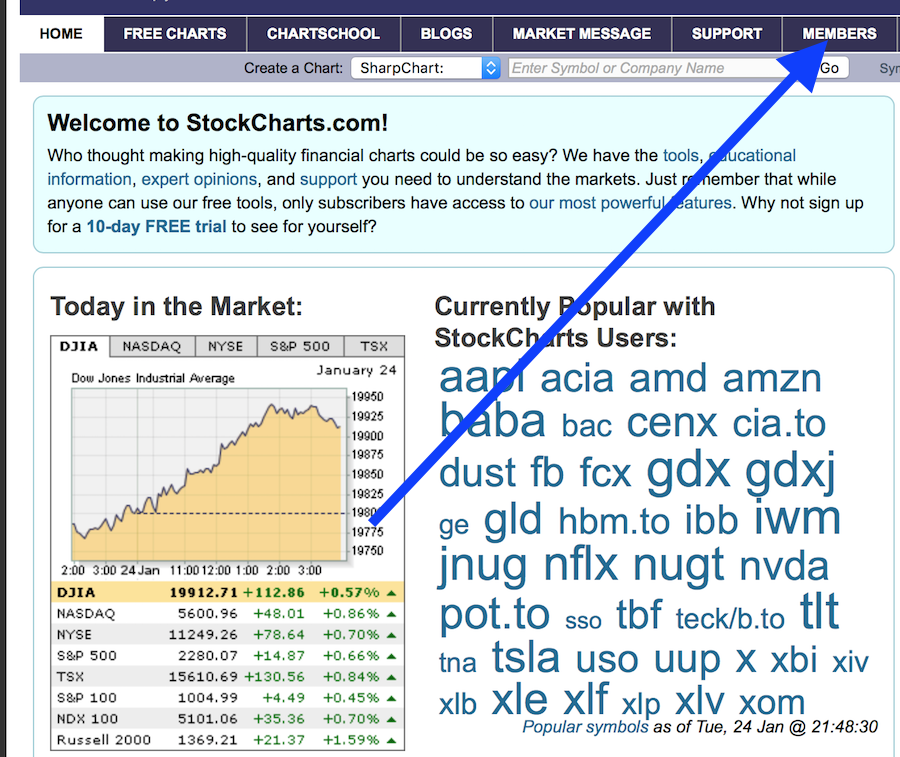 Here is the line with the Advanced Scan Workbench Link.
 Then just paste the scan code from above into the browser.
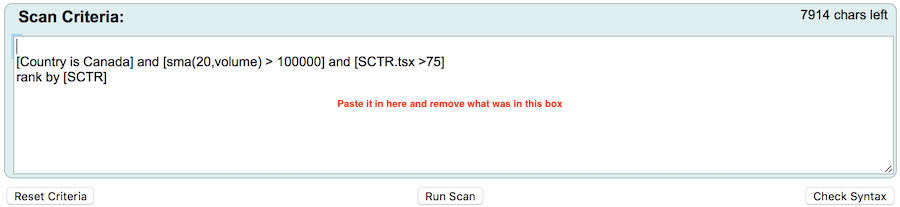 Hit run scan and it should open a new tab on your Internet browser with the scan results.
At StockCharts.com, everything we do is to help you understand the markets. I want to thank you for subscribing to the StockCharts service to empower yourself in the market to make and keep profits.
We have millions of page hits every month from investors who are not aware of StockCharts value proposition for subscribers. I've made it a goal this year to at least make every subscriber and visiting investor understand some of that unique value.
Let me make an offer that I have not done before this week. I will personally send every new member to StockCharts.com who joined in January a direct link to my BPI Chartlist with instructions for saving my BPI chartlist complete with my annotations. Those existing members who would like to have this chart in their chartlist, I will make it really easy for them as well. If you overwhelm me I'll send out a Member's only email with the link! The link will only work if you are a member or sign up for our 10 day free trial by clicking on this link. My email is gregs -at- stockcharts.com. If you don't understand this line, I covered it in the webinar as well. The next component to this is that you will be able to follow along as the BPI chart changes through my blog where I'll share my interpretation of the information on the chart. To keep up with the updates, please click the Notify me button below this article.
So a few things for you to do:
If you choose to register for my the upcoming webinars, follow these links.
- The Commodities Countdown Webinar 2017-01-26
- Chart Summit Webinar 2017-01-28. Registering through this link gets you into 18 presentations at no cost. Arthur Hill will present at this one as well.
Lastly, send me an email to get all 20 of my BPI charts into your StockCharts.com account as a chartlist. The only criteria is that it has to be the email you subscribe to StockCharts.com with. Easy enough. Send me an email using the @sign > gregs -at- stockcharts.com with the Subject line: Greg's 20 BPI charts please.
Yes, you can share this email with your family and friends.
Good trading,
Greg Schnell, CMT, MFTA
