With Gold rising last week, there appears to be a renewed interest in the precious metals theme. Canada is home to lots of precious metals resource companies so its timely to review the setup for $Gold.
Intermarket analysis is the examination of different parts of the asset markets to see if there is confirmation in a trade. There are four asset classes used in Technical Analysis. Equities, Commodities, Currencies and Bonds. Typically a rising US Dollar is correlated with falling commodities, but even that confirmation is not always true.
Using a variety of intermarket charts, I want to show how the technical analysis community can see the setup in Gold and why it becomes interesting to fundamental market analysts later.
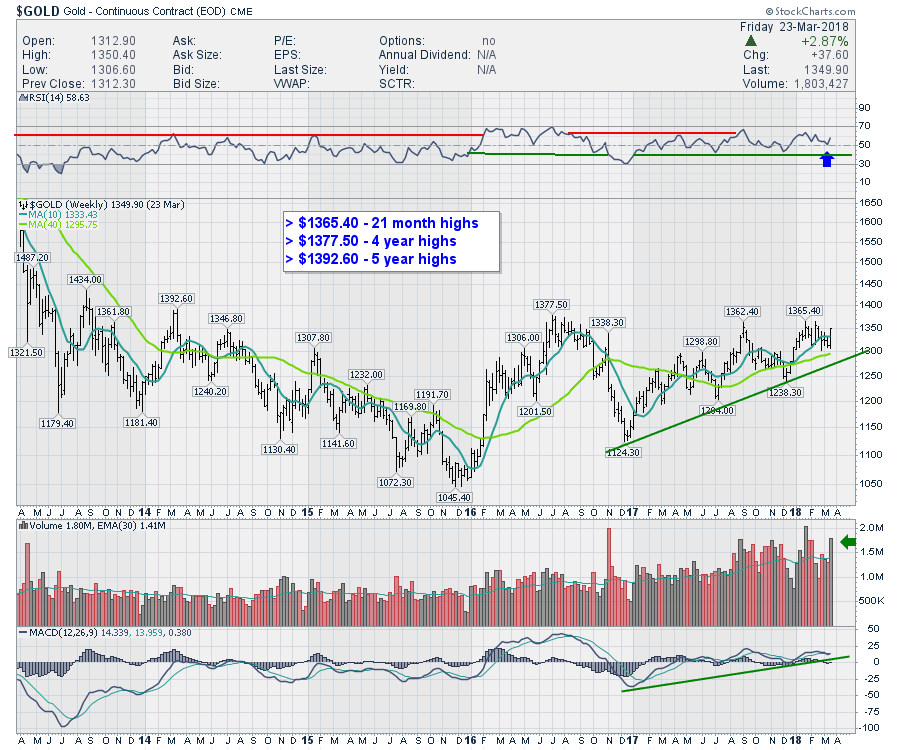
The Gold chart by itself.
- First of all, the weekly RSI is holding above 40 which is a bull market trend.
- Since January 2017, we have had a series of higher highs and higher lows, deemed an uptrend.
- Price is very close to breaking above a 5 year range
- Volume - Two of the largest positive volume thrusts in the last 5 years are recent, including last week.
- MACD - a momentum indicator is turning up while above zero. See the legend.
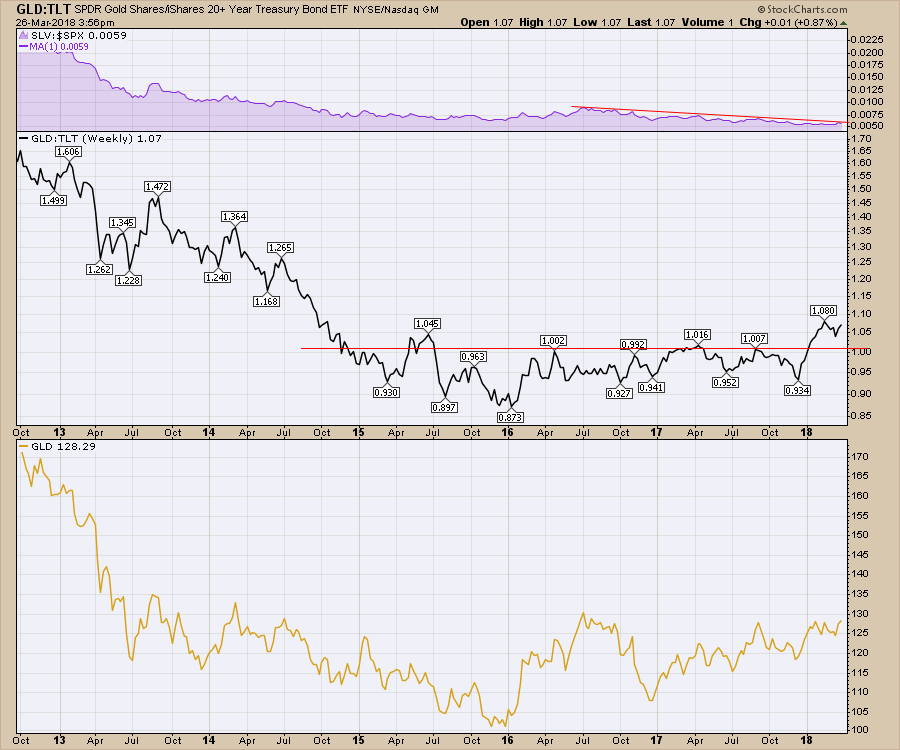
Usually momentum traders are looking for outperformance, so if an area of the market starts to outperform on price movement, this will show up on scans across the market. On the chart below, we compare GLD, the gold tracking ETF, with the SPY which is the tracking ETF for the S&P 500. When Gold outperforms, this chart rises. When Gold underperforms, this chart falls. Clearly, GLD has underperformed the SPY for 5 years. Breaks in the trend lines are meaningful and can create sudden surges in the stocks related to gold like gold producers. It is possible for these stocks to run significantly when the setups align.
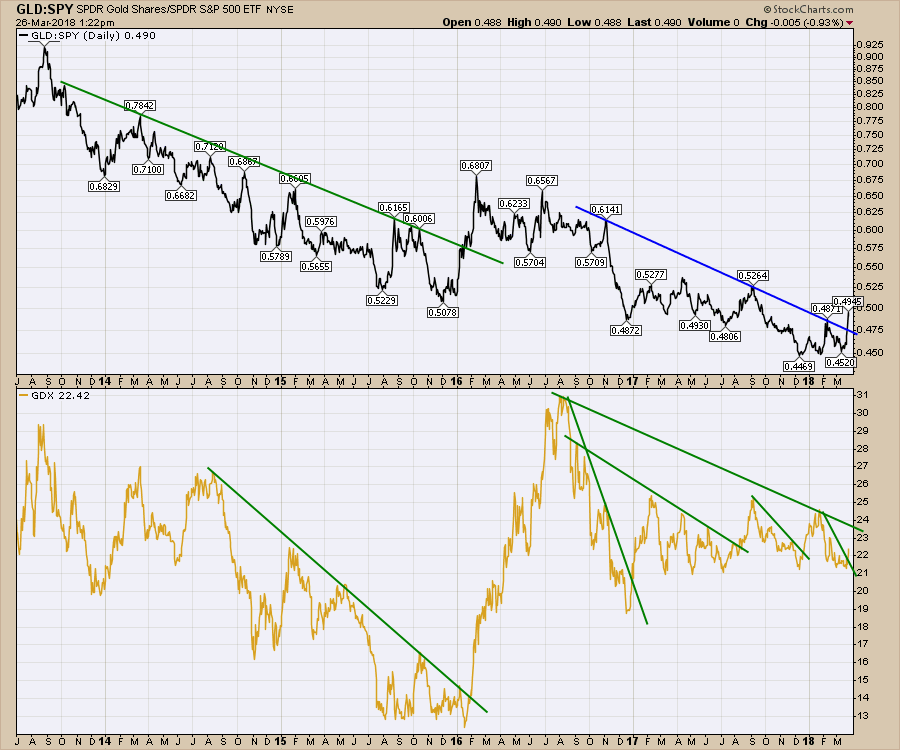 Staying with the chart above, I have put the GDX ETF in the lower panel. We can see when the long term trend line was broken in GLD and GDX in early 2016, both charts soared to the upside. The change in GDX was 140% in 6 months while GLD moved 25%. The longer the trend line, the more important the breakout. We got a breakout in the long GLD trend last week, and the GDX trend has broken a short term down trend. Notice each one of these short term down trend breaks were followed by upside action.
One more point that needs to be emphasized. The overall markets had a rough patch going into 2016. When Gold started to outperform at the end of the market correction, momentum traders really pushed into momentum trades in the gold stocks.
Gold is also correlated with the mining stocks as mentioned. When the miners (GDX) outperform GLD, this is also a bullish sign. The top panel would start rising. When it starts, we don't know if it will be a huge rally or not. When more long term trend lines are broken within a few months of each other, the more likely the change in trend is important.
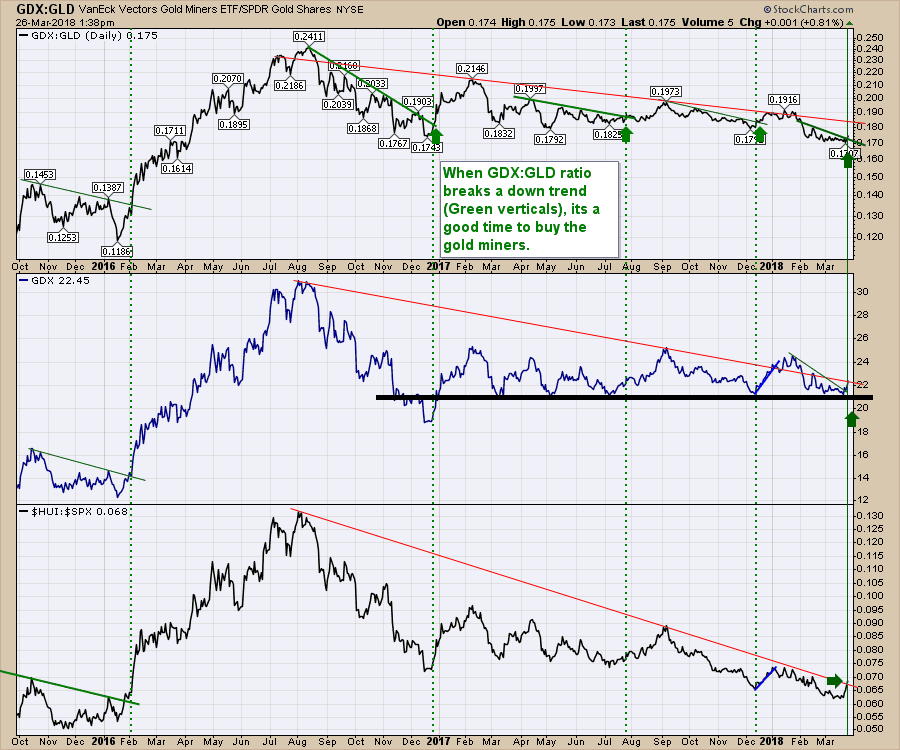 While hindsight always makes drawing trend lines more obvious, there are some long trends here. In the center panel, we can see the GDX broke above the trend and fell back down. Leaving the trend line is place, it suggests it was a whipsaw where the price jumps up and retreats. For now, we can leave it in place. However, that trendline is being pushed through again now, so that can be confirming the initial whipsaw was the right direction. With the volume discussed on Chart 1, it does make more sense to use the whipsaw as a signal that upside breakouts have buying interest. In the bottom panel, we have compared the Gold bugs index with the $SPX. This Gold Bugs Index is a basket of modified equally weighted gold mining companies. It is breaking out right now. This also broke out in the big upside move back in 2016.
The discussion above has looked at gold itself, gold compared to the gold stocks, the gold stocks compared to the S&P 500, and an equal weight basket of gold producers compared to the S&P 500. They all look set to breakout to the topside.
Currencies:
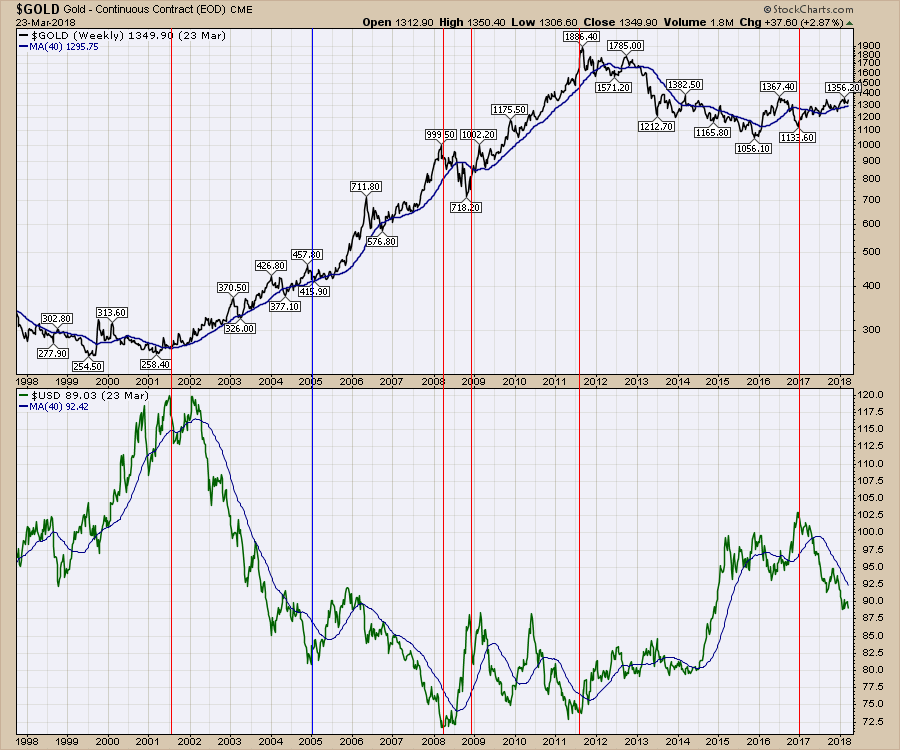
US Dollar
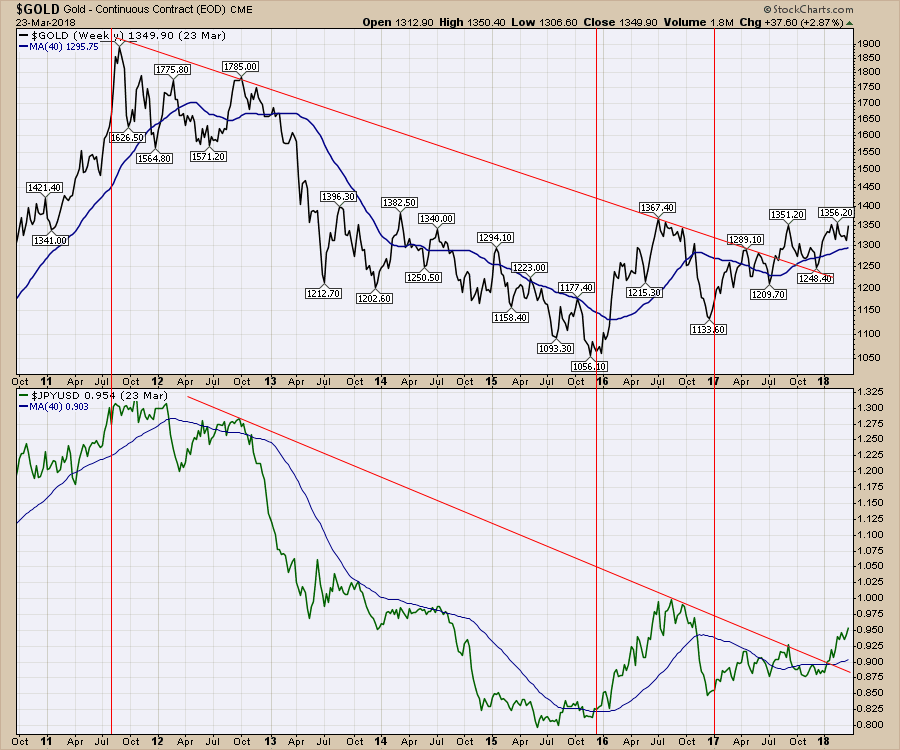
The big picture correlation between Gold and the US Dollar is obvious on this long term chart. However, the period after the blue line shows the two markets moving in the same direction for a year.
 But one foreign currency tracks the gold price pretty well. The Japanese Yen broke a downtrend shortly after Gold did, so I was expecting both to accelerate. While the Yen has gone higher, the Gold price has consolidated sideways since the new year. The Yen made a nice thrust on Friday and Gold jolted higher. On a long term chart, the 0.95 level is huge for the Yen. A break above that is another supportive relationship for Gold breaking higher.
 Lastly, the relationship to bonds. Bonds move slower, so it is not that hard to outperform bonds. However, in the start of Gold's decline, when it was underperforming, gold really fell hard. Now it is outperforming.
 To summarize:
- The Relative Strength to the $SPX is at 6 month highs
- The gold miners are starting to outperform Gold.
- The US Dollar appears to be continuing to break down.
- The Japanese Yen is breaking out and the chart shape is similar to Gold.
- Gold is outperforming bonds for the first time in three years.
With Gold starting to outperform all the other asset classes, this suggests a move towards the precious metals. Thousands of lines of spreadsheets could work to compute the setup conditions, but the charts bring the investment potential into focus quickly and succinctly.
While technical analysis is a windsock, it is not a crystal ball. Everything is lining up for Gold to have a powerful run. Stay tuned as it tests through $1365.
Good trading,
Greg Schnell, CMT, MFTA
