After the Fed meeting last two weeks, the market pulled back on Thursday with a big rally on Friday, which, despite having significantly less volume, managed to close above the September high.
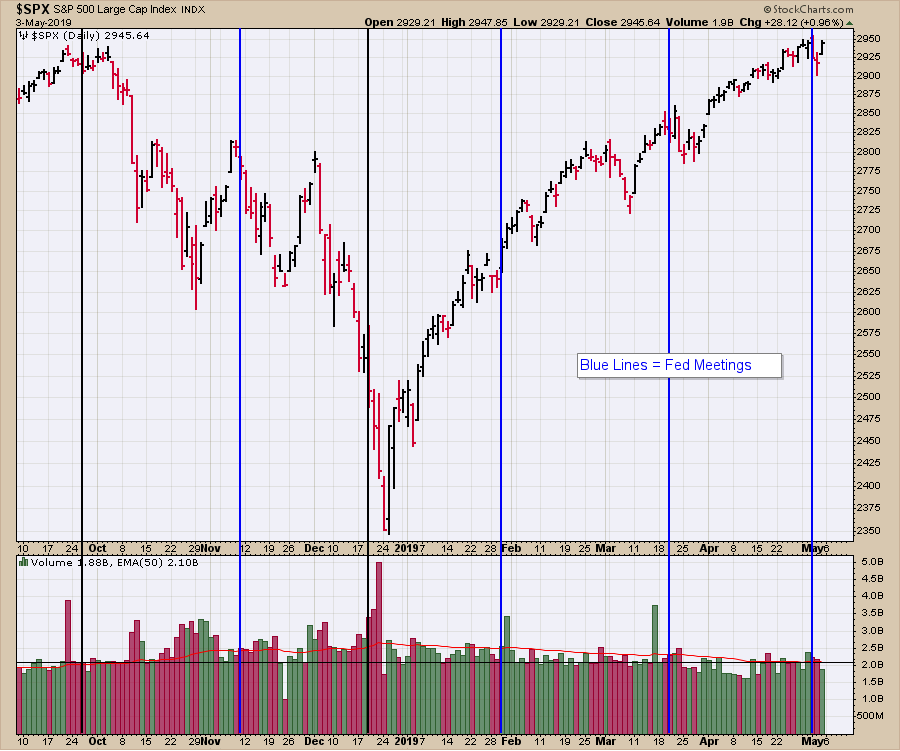 One of the concerns as we test a prior high is breadth. So far, we have had strong breadth readings in both Net New Highs and the Advance/Decline line. Other breadth readings, such as the percentage of stocks above the 200-DMA, are good; additionally, the Bullish Percent Indexes for the $SPX and $NDX are fine.
That does not mean the market can't still pull back from here, as testing a prior high is always a place to watch for some resistance. The Fed meetings of January 2018 and September 2018 both marked the highs. If we add in a Fed meeting to the current setup and some sector rotation into defensive areas of the market, that could mean a pause here.
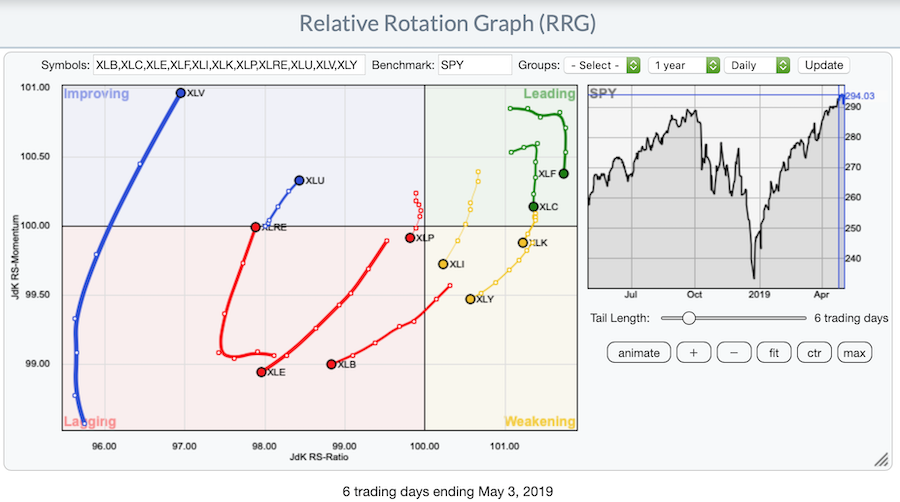
Sector rotation can be seen on this daily RRG chart. For those not familiar, the groups moving up and to the right are improving and the groups moving down and to the left are weakening. Currently, the XLV, XLU and Real Estate are improving. The bold dots mark the most recent data points and the tails show where they were over the last few days.
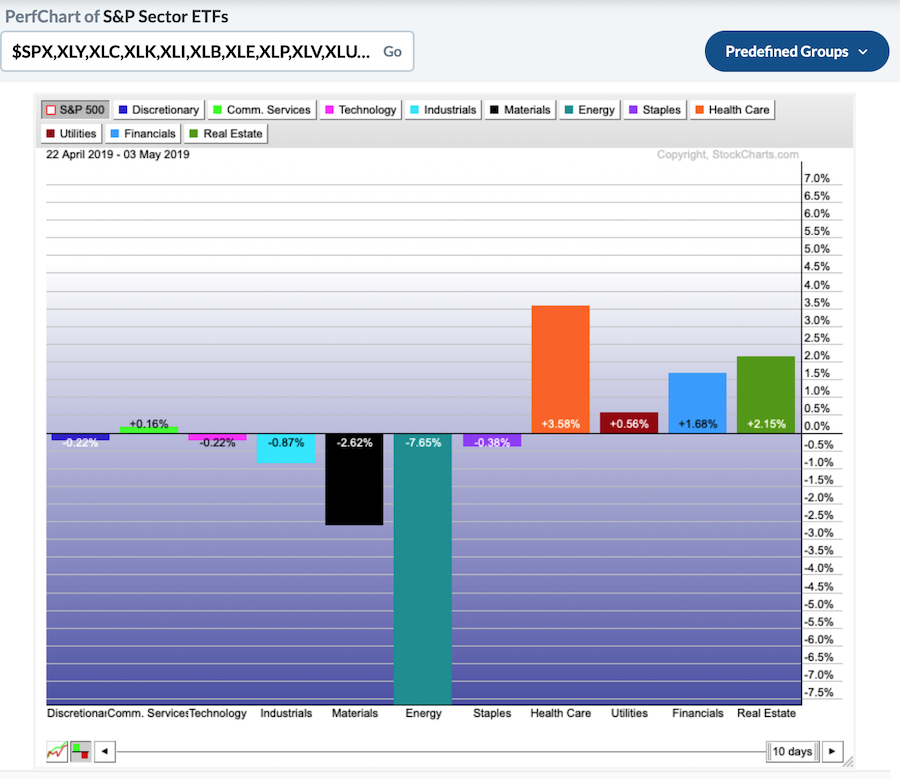
 Looking at sectors on a PerfChart, we can see that the defensive sectors have been leading the last two weeks.
 Sunday's announcement regarding tariffs may create some sparks or friction to deal with. The instability that popped up in Israel and North Korea probably wouldn't have affected the market otherwise, but they are now another source of caution.
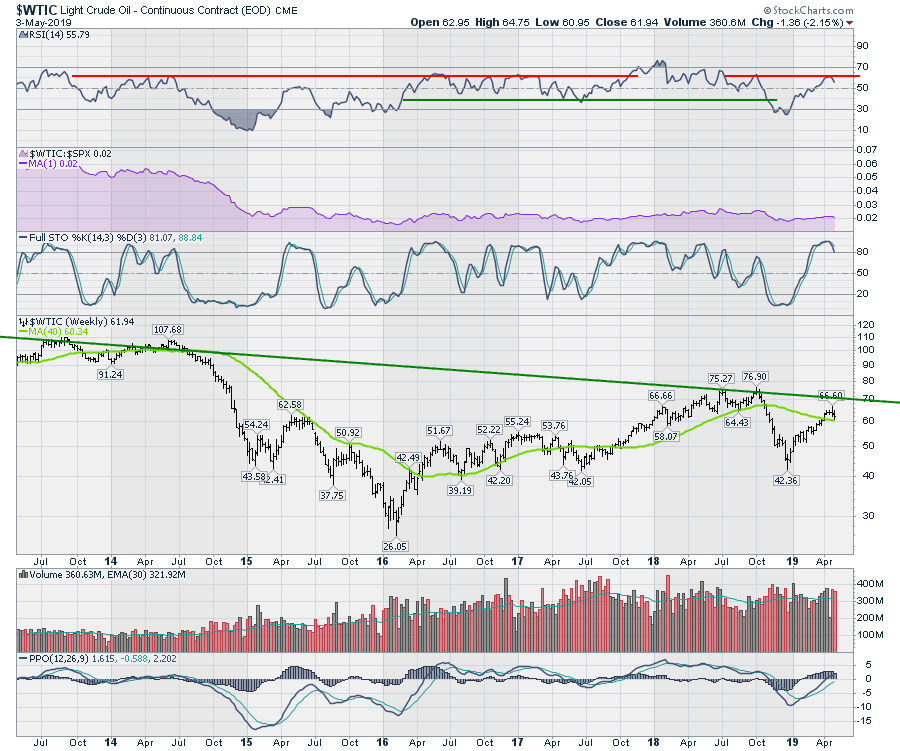
Commodities had a tough week pretty much across the board. Oil is rolling over after pushing above the 40-week moving average. Unfortunately, lots of the indicators are breaking down. The RSI is breaking down at a typical location for a new bear market after the signal in December. The PPO momentum is rolling over near zero, while the full stochastic is also rolling over. This is a difficult place for the oil market to show weakness.
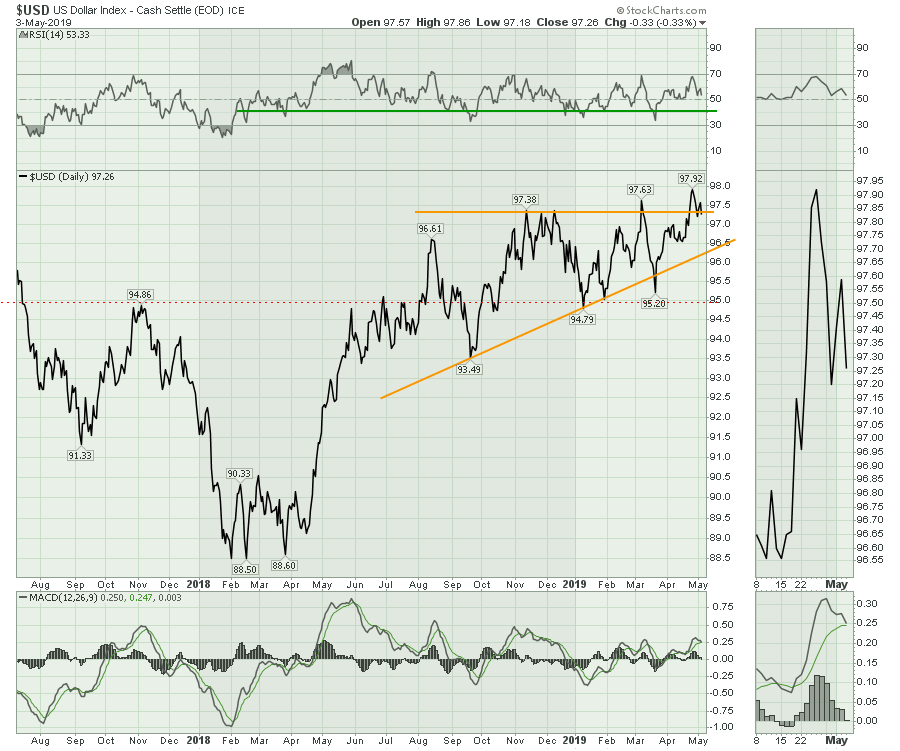
 I think the biggest question of the week has to be the US Dollar. This daily chart shows the US Dollar trying to break out, but ultimately it finished the week down a little.
 While the rest of the world has underperformed, one place to watch to see if an improvement in foreign markets might be happening is the All-World ex-US ETF (VEU) and the Emerging Markets ETF (EEM).
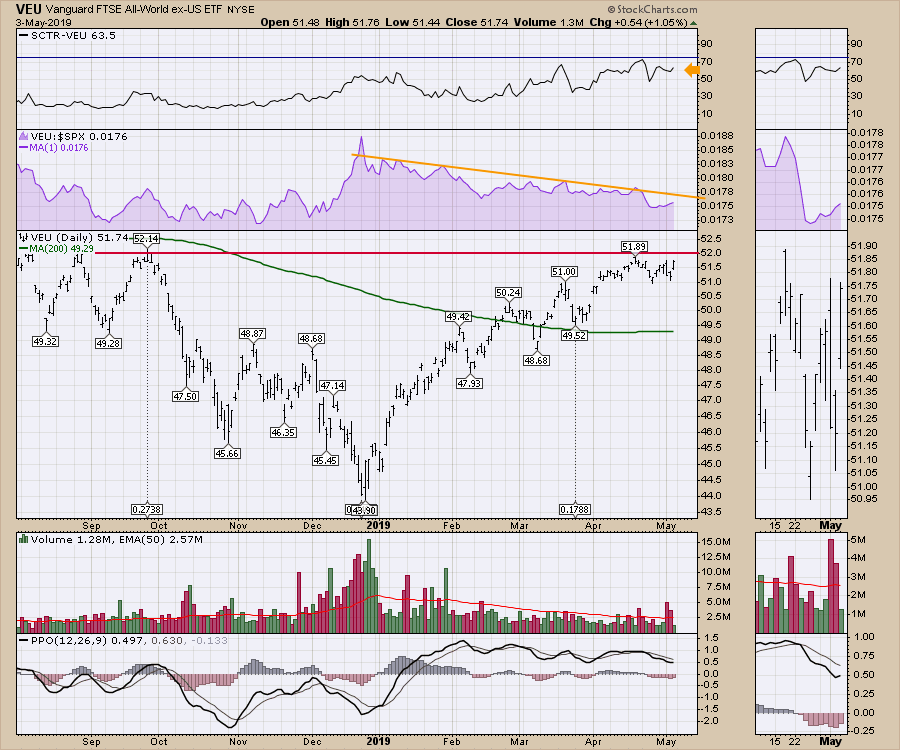 Currently, the SCTR reading of 63 on the chart above suggests the price action for VEU is mediocre. We would like to see it become a top performer above 75. The relative strength in purple is still declining.
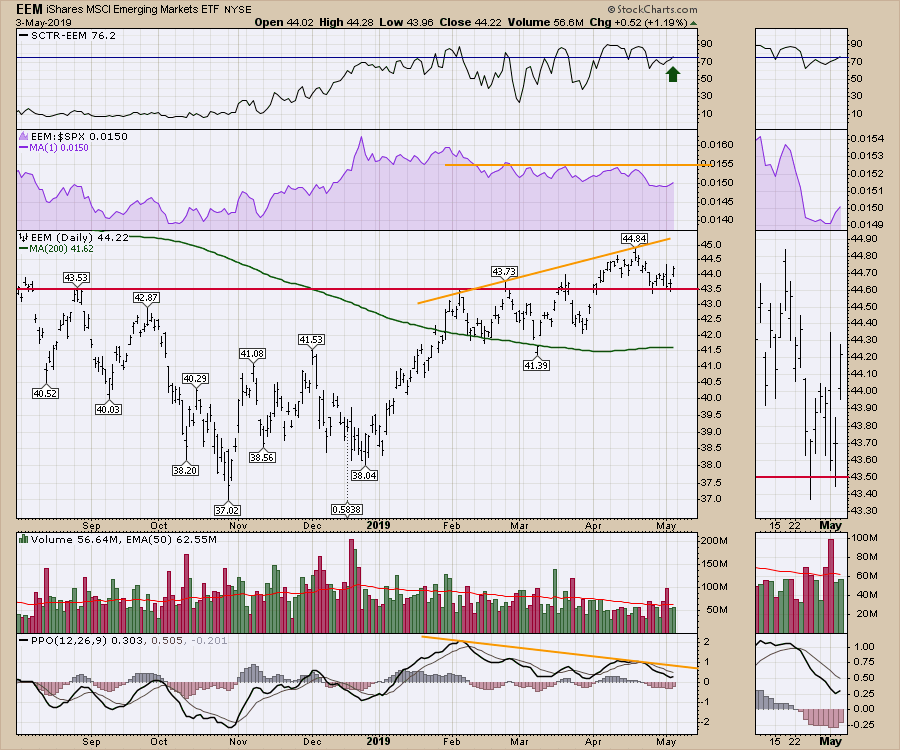
Moving onto the EEM chart, the SCTR ranking is at 76, which is better. The relative strength in purple is still sloped down, showing underperformance by the emerging market ETF. Price action looks a little better, making a new high above the September market top. The chart trend is climbing. However, the most recent high made a lower high in momentum, so this is an important area to watch.
 There is a lot more content available on this week's Market Roundup video. (Click below to play.)
 In the week ahead, I want to watch for how the markets react to the pauses in the China trade talks. At the time of writing, there were threats both ways.
Looking at the big picture, there is a setup that suggests the economic activity globally is getting weaker. Global PMI readings have been declining for 12 months, marking the longest decline since the 2009 lows. This doesn't matter until it does. The USA PMIs are still positive (above 50 is positive) but this chart of the Composite PMI for the US market has hit new two-year lows.
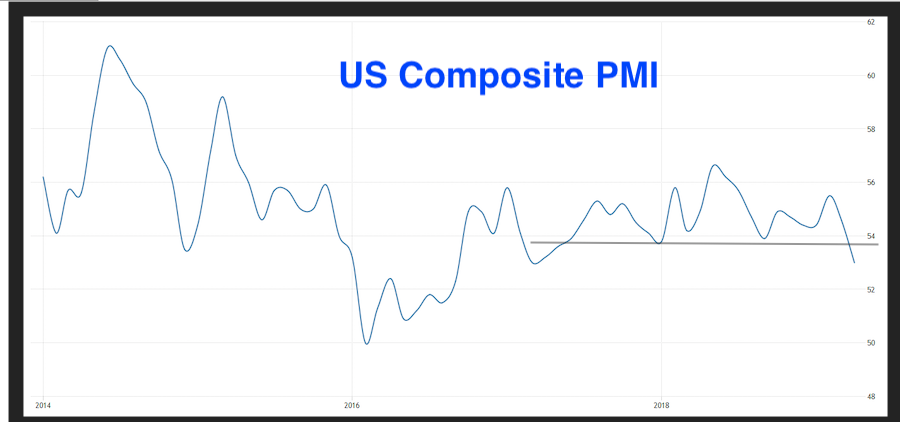 (Source: IHS Markit)
Many indexes around the world are testing prior highs, so this is an important area of resistance to get through. If the markets globally stall here, this is a bigger problem. Canada, which does a lot of business with the US, just saw the Purchasing Manufacturer Indexes (PMIs) contract below 50. In reading through some of the major global market data around PMIs, the words "sudden" and "sharp" are used to describe falling first-quarter orders in multiple areas. Europe has had three months in a row of contracting economic activity, while China was marginally positive at 50.2.
Some charts are breaking down together, such as oil and copper. Both of them have relevance as global economic indicators; them slipping together is not a positive sign.
Ultimately, it all adds up to the need to be a little more focused on protecting gains, following a 25% run off the lows.
Good trading,
Greg Schnell, CMT, MFTA
Senior Technical Analyst, StockCharts.com
Author, Stock Charts For Dummies
Want to stay on top of the market's latest intermarket signals?
– Follow @SchnellInvestor on Twitter
– Connect with Greg on LinkedIn
– Subscribe to The Canadian Technician
