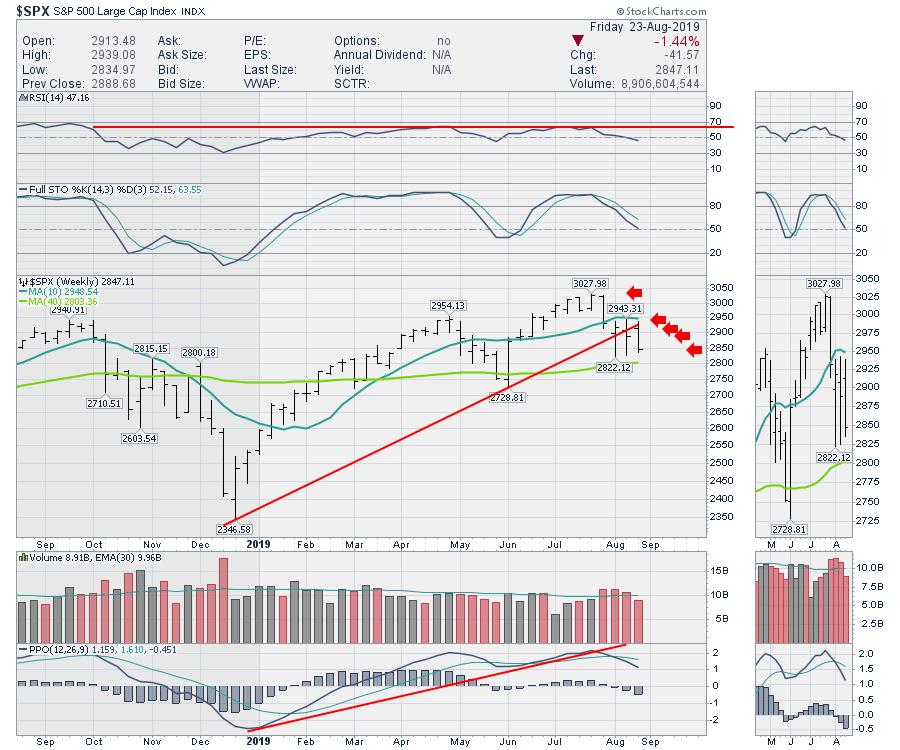
Another week, another lower close. With four weeks of lower closes, the trend continues to be down. While we have made higher lows the last two weeks, it now appears that the early August low will be tested. One of the defining features of corrections/bear markets is an increase in the average true range. On that note, look at how small the weekly bars were on the way up compared to the last four weeks.
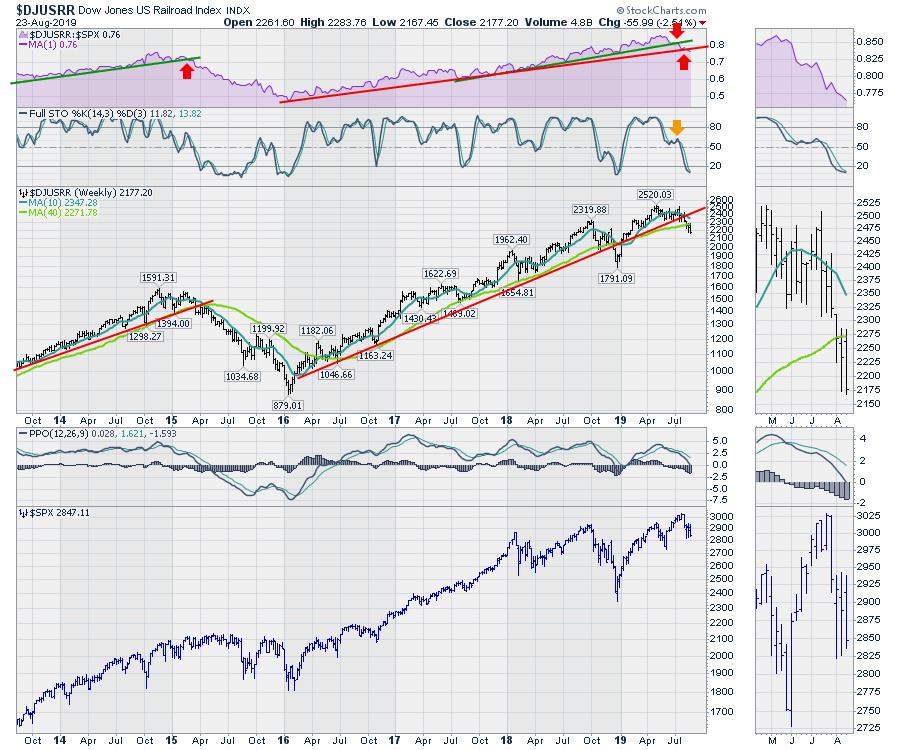
Friday's price action on the indexes was a road lower as more news came out regarding trade. I continue to worry about trade volumes as we start to see the rails underperform. I wrote about the rails a few weeks ago, but the chart continues to break lower in relative strength. Notice when railroads underperformed based on the purple area on the chart, as well as when the PPO went below zero (showing negative momentum). Friday shows the PPO just a smidge above zero. In October 2018, the relative strength uptrend in purple didn't break, even though the price trend did. Now, the relative strength is broken as price falls below the trend line.
Global indexes are a problem, but I'll post those next weekend on the month-end charts so that the bars are complete.
My conviction that this is becoming a major break in the charts is getting firmer. I have to contrast that with some of the technicians I respect, who are suggesting this is the low before we ride higher in the 4th quarter. The $DJW index covers off my concern and an example of the alternate view. I have to think the global trade slowdown is just starting to infiltrate companies and countries worldwide. Back in 2015 (red arrow), momentum was trending down, then dipped into negative territory and bounced as the global economy rallied to a final high. It is this setup that I see happening again. The $SPX in the lower panel rallied to new highs, but the global markets diverged. Charts like the railroads above support this thesis.
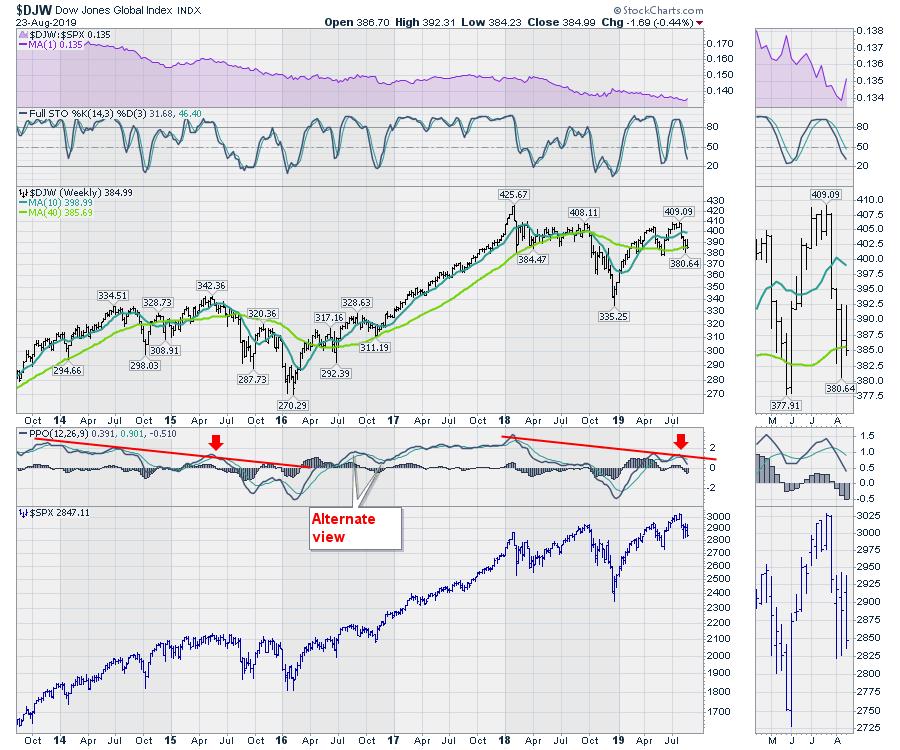
However, the alternate view (shown above) suggests that we have already seen the lows in momentum and are now just pausing before we surge higher. I would pontificate that when a China trade agreement shows up, that is what we would see. With China adding tariffs Friday morning and Washington responding by telling companies to exit China, this is not over. Add in late Friday issues of more tariffs sooner and it looks like trade momentum is dropping, not rising.
Below is a performance chart comparing percentage gains since the Fed meeting just before the 2016 US election. Leading up to January 2018, every one of the markets shown were climbing, albeit at different rates. Fast forward to now, the entire group is below the January 2018 highs, showing the US as the last market making a high.
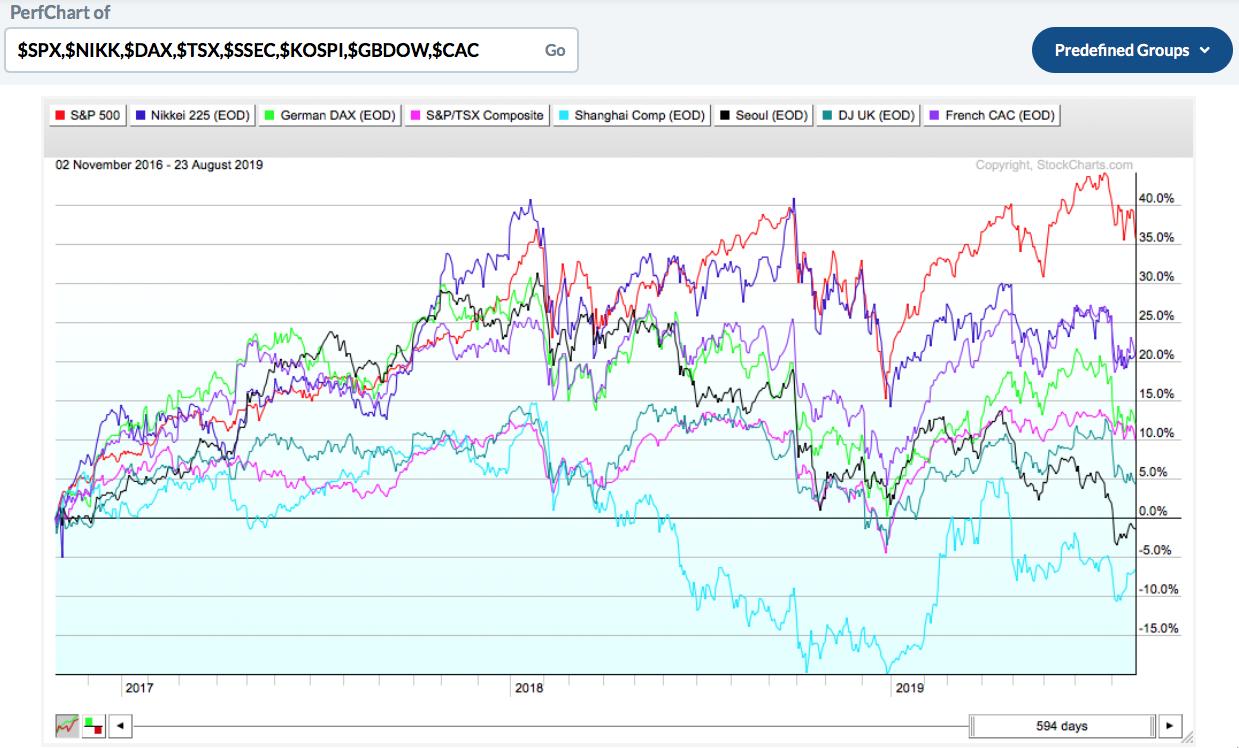
If I used Brazil, Russia and Australia, I'd see that they have made recent highs along with the USA. The volume of trade being disputed with the USA is through the technology and automotive industries, so my bias is that global trade in finished goods is being impacted. You'll need to decide which countries are more relevant at this turning point.
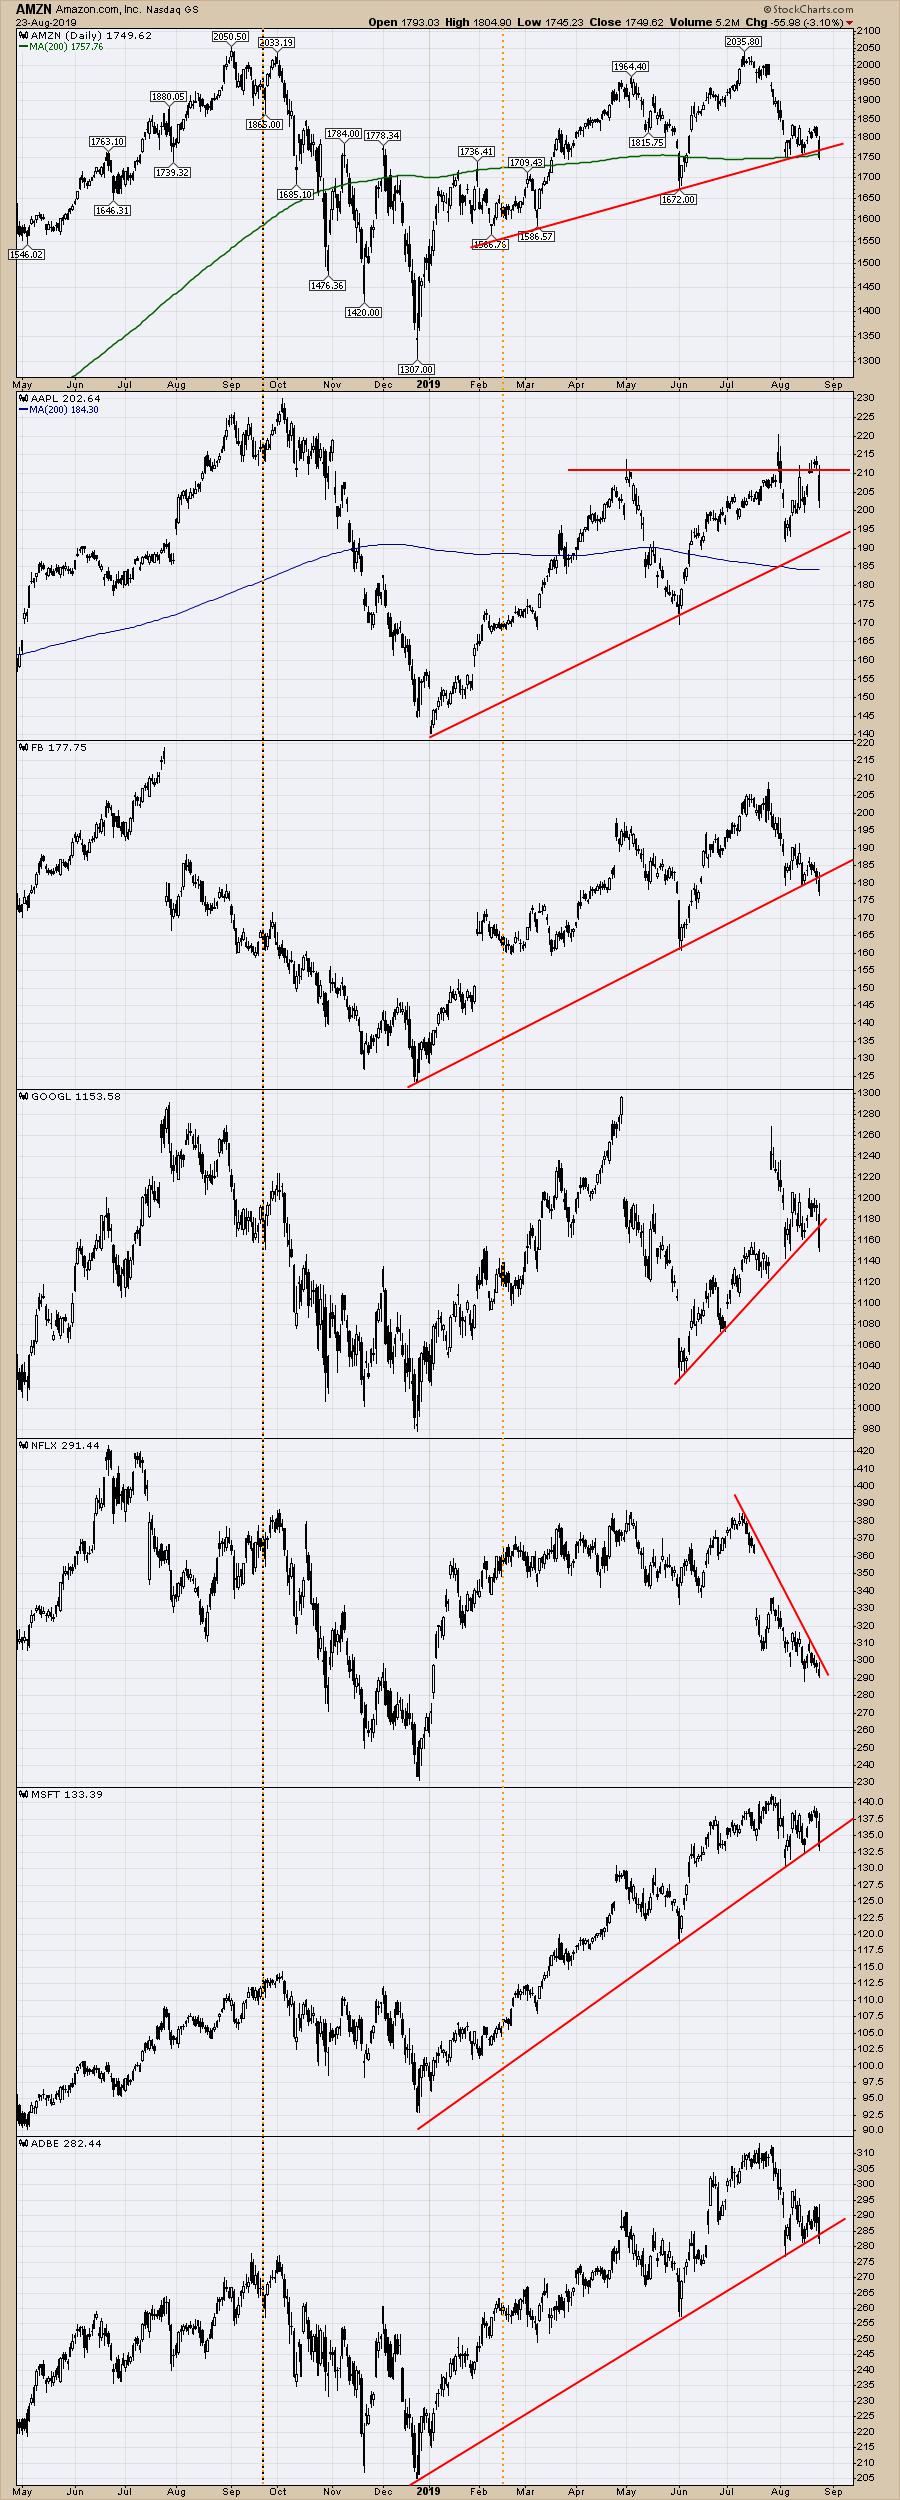
This chart of some of the technology names needs to firm up. If large-cap tech breaks down, it seems difficult to imagine that things are so good elsewhere that they'll soar without large-cap tech.
An important week lies ahead. Monthly bar charts will show the complete picture, but so far they point to the top being complete, with this as the last rally.
Weekly charts would have to see a massive reversal to turn the momentum indicators up. I don't expect it, but that is why we look at the charts every week. As always, there's lots more on the video (A Wobbly World)!
Good trading,
Greg Schnell, CMT, MFTA
Senior Technical Analyst, StockCharts.com
Author, Stock Charts For Dummies
Want to stay on top of the market's latest intermarket signals?
– Follow @SchnellInvestor on Twitter
– Connect with Greg on LinkedIn
– Subscribe to The Canadian Technician
– Email at info@gregschnell.com
