All-in-all, last week was a down week for the major market averages. While the Dow managed to eek out a tiny gain, the other indices fell with the Nasdaq (-2.79%) leading the way. So far this year, the energy-heavy Amex Composite (+5.64%) and the Russell 2000 (+4.75%) are outpacing the other markets with the Nasdaq off 0.38% and the Dow essentially where it began the year.
"Change" appears to be the theme for this week's edition. John and Richard both look at changes that are underway in the sector picture, Carl has indications that change is coming to the Precious Metals sector, and Arthur looks at changes in the Nasdaq's OBV chart. But first, I hope to "change" your approach to scanning...
SCANNING FOR CHANNELS
In the past, I've written articles on scanning for Divergences, Cross-Overs, and P&F Signals. This week I'd like to demonstrate how one goes about scanning for Channels. A Channel is a pattern where a stock has been moving sideways within a given range for a given period of time. In the example below, DELL has been moving sideways between 30 and 40 for over 6 months.
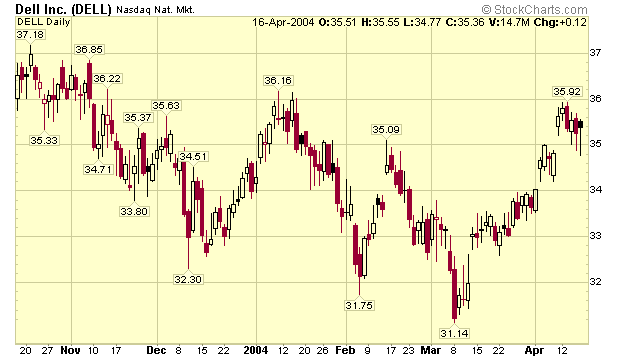
In order to scan for stocks in a channel, you have to decide up front what the upper and lower bound of your channel will be along with minimum the length of time that a stock has to remain within that range. Let's see if we can find other stocks that have been bouncing within the same 30-40 channel that DELL has been in for at least 6 months. We can use the Standard Scan Interface for this (I recommend always using the Standard Scan Interface whenever possible). The "secret" to creating this kind of scan is to use the "Max. High" and "Min. Low" functions. Each one takes a single parameter which is the number of periods (days or weeks) to look back. Here's what the completed scan looks like:
The key lines are in the "Additional Technical Expressions " section. The first line makes sure that we only look for stocks that have not risen above 40 during the past 6 months (= 6 x 4 = 24 weeks = 24 x 5 = 120 days). The second line checks to see that we only find stocks that have not fallen below 30 during those same 6 months.
I can run this scan and then use the CandleGlance technique described in my article "Visual System Development" to verify that the results returned by the scan are correct. Right now (Saturday, April 17th), the scan is returning 63 stocks including DELL (of course), YUM, and even QQQ!
SCANNING FOR CHANNEL BREAKOUTS AND BREAKDOWNS
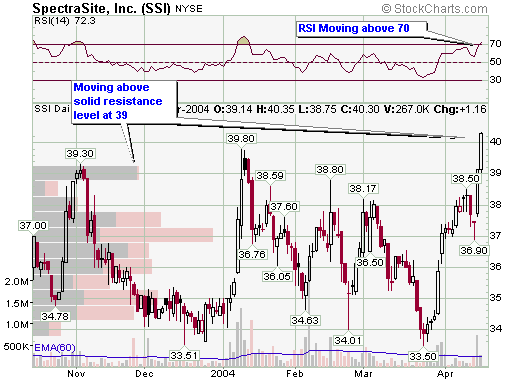
It's a simple matter to enhance the scan above so that it finds stocks that have just broken out of a channel. Simply add a 1 period offset to the "Max. High" and "Min. Low" criteria lines and then check to see if "today's" close is above/below the limits of the channel. For example, here's a scan that finds all of the stocks that have just moved above the top of the 30-40 channel we've been using:
Right now, only one stock meets that criteria - SSI. Is SpectraSite breaking out? There are several positive developments on its chart:
As always, successful scanning requires you to carefully review these examples, experiment with them until you are comfortable with how they work and then carefully incorporate them into your analysis work. Since scans can be used (and mis-used) in so many different ways, YOU need to invest time and effort in learning all about them first but I guarantee you that it is time and effort well spent. Hopefully, this article (and the previous ones I linked to) will help you get off on the right foot.
