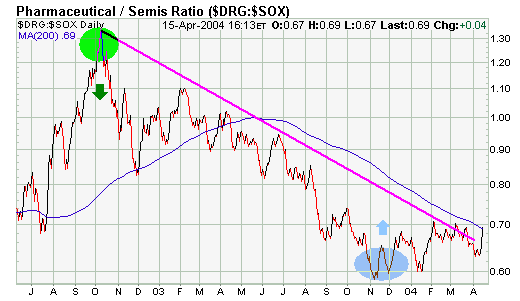
DRG/SOX RATIO IS RISING... Earlier in the year I did an analysis of the DRG/SOX ratio as a way to try to measure the mood of the market. The ratio divides the Drug Index (DRG) by the Semiconductor (SOX) Index. The idea is that when investors are confident they buy chips and sell drugs. That pushes the ratio lower. That's what happened during October of 2002 when the market bottomed (see green circle). The downtrend in the ratio continued until last November when it started bouncing (blue circle). Its been trading sideways since then as the market rally has stalled. When investors turn more cautious, they sell chips and buy the more defensive drugs. That pushes the ratio higher. The DRG/SOX ratio is approaching the top of its six-month range and is close to moving above its 200-day moving average for the first time since last spring. The ratio has already broken its eighteen-month down trendline. An upside breakout in the DRG/SOX ratio would, in my opinion, signal a significant shift to a more defensive market mood. The two main reasons for that are rising energy prices and rising interest rates. That also explains why investors are selling rate sensitive stocks and buying energy. None of these rotations are good for the market as a whole.