At the height of last Wednesday's big decline all of the major averages except one had moved below their 200-day (40-week) moving averages. This was the first time that had happened since the start of 2003 and it is another important technical milestone that occurs as a significant uptrend turns into a significant downtrend. First the 50-day MA is broken, then the 50-day MA starts moving lower, then the 200-day MA is broken, and finally the 200-day MA starts moving lower.
Each of those milestones is important and watched closely by the market. Don't believe it? As soon as the S&P 500 moved below its 200-day MA on Wednesday, the market started rallying. Money managers said to themselves "Things have fallen enough, let's start buying some bargains." Wednesday's afternoon rally (+196 points on the Dow) erased the morning's losses, but the psychological technical "damage" remained. Having broken the 200-day MA once recently, the market may not be in such a buying mood the next time it happens.
Later in this issue, John Murphy, Carl Swenlin, Richard Rhodes and Arthur Hill provide even more reasons for using Technical Analysis, but first...
GETTING AHEAD WITH "BEHIND"
One of the best parts of my job is introducing you to important new features that we've added to StockCharts.com. Last week, we quietly added one of the best new features ever - overlaid charts. Overlaid charting allows you to place the chart from two or more ticker symbols or indicators on top of each other on the same chart. You can find this new feature in the "Beta 4" version of our new SharpCharts 2 charting engine.
To create an overlaid chart, simply select "Behind" from the dropdown located to the left of any of the "slots" in the "Indicators" area below the chart. Before now, you could only select "Above" or "Below" from that dropdown. The addition of "Behind" opens up whole new worlds of charting possibilities. Here are some examples:
Comparing a Stock's Price Movements to an Indicator's Signals:
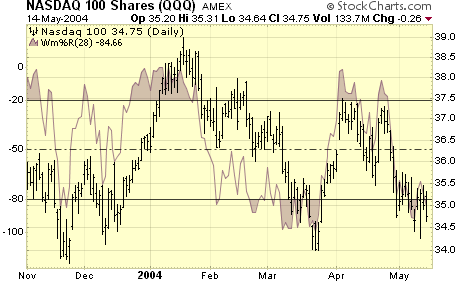
Here we have the 28-day William's %R overlaid (underlaid?) with the Qs. This chart shows you quite clearly how the indicator has moved into the overbought and oversold areas ahead of significant reversals by the stock in late 2003 as well as in March 2004.
Note: The vertical scale for QQQ is on the right, the vertical scale for William's %R is on the left.
Comparing a Market Index to several Market Breadth Indicators:

Here we see the NYSE Composite Index in blue, the cumulative NYSE Advance-Decline Line in black, the NYSE McClellan Oscillator in red, and the NYSE New Highs-New Lows in green. Notice how, at the start of April, the McClellan Oscillator (red) turned lower before the other indicators did?
Note: Right now, overlaid indicators can only appear in "Line" mode. In order to chart the Advance-Decline line in Cumulative mode, I have to make it the "primary" ticker symbol for the chart. The other lines were added to the chart using the new "Price" indicator and the new "Behind" position setting.
Intermarket Analysis:
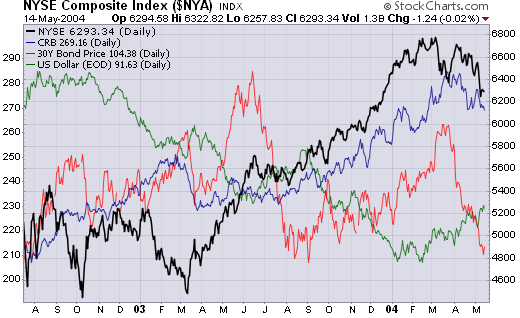
Here's a chart that John Murphy followers will love - the four major Intermarket indices overlaid all on one chart. While we still recommend using our interactive PerfChart to perform Intermarket analysis, this chart can also shed light on the topic. For instance, the recent weakness in bond prices really stands out here.
Overlaid charting opens up a whole new world of possibilities for your analysis. Watch out for even more features to appear over the next month or so. In the mean time, please give "Beta 4" a try and use the Feedback link on that page to let us know what you think!
