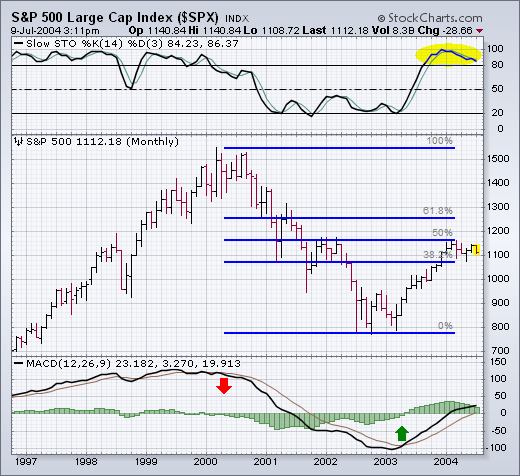
This is a good time to stand back and try to put things into a longer-term perspective. First of all, let's see why the 2004 rally has been stalled. The monthly bars in Chart 1 show that the S&P 500 ran into major chart resistance at its early 2002 peak. The horizontal blue lines also show that the S&P had retraced 50% of its 2000-2002 bear market. The monthly stochastic lines also show an overbought condition over 80. That was a logical spot for the cyclical bull market to stall. And stall it has -- for the entire first half of 2004. The monthly MACD lines have been converging since the start of the year (which usually reflects loss of upside momentum), but are still in positive territory. The last sell signal was given near the start of 2000. The last buy signal was given in the spring of 2003.