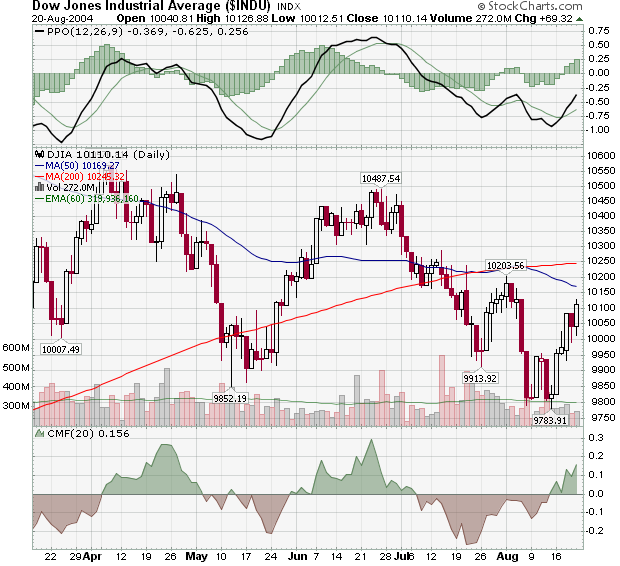
Since setting a new low of 9783 last Friday, the Dow moved higher during four of the last five days and is now approaching the 10203 peak that it set back at the start of August. This rally - and the successful IPO of Google - has greatly improved the general mood of the markets however resistance from the 50-day MA line - not to mention the rising price of oil - make it is likely that the Dow reverses before moving above that August peak. I'm looking for a retest of the 9783 low in the next couple of weeks.
While you wait to see what happens, why not kick back and enjoy this jammed-packed issue of ChartWatchers? After I continue my series on John Murphy's Ten Laws of Technical Trading, John looks at a little known ETF that is breaking out right now, Carl sees several Bullish signals on his S&P 500 chart, Richard sees a declining economy in 2005, and Arthur finds evidence of lower inflation expectations by bond traders.
LAW #5: DRAW THE LINE
Murphy's Law #5: Draw trend lines. Trend lines are one of the simplest and most effective charting tools. All you need is a straight edge and two points on the chart. Up trend lines are drawn along two successive lows. Down trend lines are drawn along two successive peaks. Prices will often pull back to trend lines before resuming their trend. The breaking of trend lines usually signals a change in trend. A valid trend line should be touched at least three times. The longer a trend line has been in effect, and the more times it has been tested, the more important it becomes. - John Murphy
It still amazes me how many people, when they first get into technical analysis, jump straight into indicators and oscillators without first learning the core concepts of support, resistance, and trend. Although I've said it many times before, I'll say it again here: At its core, Technical Analysis is about detecting stock trends in time to take advantage of them financially. Step one in that process is to look at the charts are draw trend lines. This is how smart ChartWatchers "pay their dues" and develop confidence in their projections. Its the basis for chart pattern analysis and it sets the stage for understanding indicators and oscillators. When in doubt, go back and redraw your trend lines. Properly created trendlines are always correct - the question is "Can you see what they are telling you?"
Trend lines aren't magic. They work for the same reason that support and resistance lines work. The majority of the people that are trading a giving stock feel that the intrinsic value of that stock has changed and that change is getting "priced into the stock". Why the value changed isn't important. How the majority came to their conclusion isn't important either. The job of trend line analysis is to detect that a change is underway and what its direction is.
As John indicates, drawing trend lines is all about finding "significant" peaks (AKA highs) and troughs (AKA lows) on a chart and then connecting the dots. It's actually harder than it sounds, but with a little practice, anyone can master it. One of the hardest things to learn is how to spot a real reversal - something that I wrote about last year. Now would be a great time to re-read that article (and bookmark it for later study!).
Another "gotcha" with trend lines is to forget to check the "Scale" setting for the chart you are looking at. Trend lines on logarithmic scale charts are very different from trend lines on arithmetic scale charts. Our ChartSchool article on Trendlines go into much more detail.
Creating your own trend lines at StockCharts.com couldn't be simpler. Just create a SharpChart for the stock that you are interested in and then click on the "Annotate" link located just below the chart. After our Java-based ChartNotes program loads, you can simply click and drag to create as many trendlines as you want. If you are a member of our Extra service, you can even save your annotated charts in your account and then see how your trendlines "hold up" over time.
You should also experiment with the "Zig-Zag" price overlay when learning about trend lines. While it has some significant limitations, it can help you spot significant peaks and troughs automatically. For more info, see this ChartSchool article.
Of course, there are several great books in our bookstore on trends. One of my favorite is "an oldie but a goodie" - William Jiller's "How Charts Can Help You in the Stock Market". Written in 1962, it shows the timelessness of these ideas in a clear, concise format that's MUCH less expensive ($14.45) than the Edwards & Magee book while covering much of the same ground. Of course, John's classic introduction book is similarly priced and similarly useful.
Can't wait for the next installment? Click here to see all of John's Ten Laws of Technical Trading.
