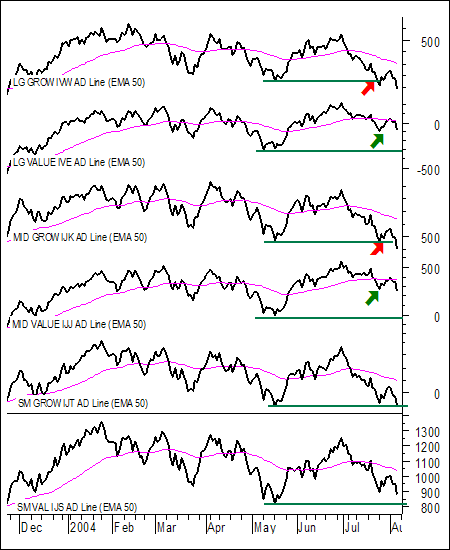
The AD Line is a cumulative measure of advances less declines within a given group of stocks. For example, the S&P Large-Growth ETF (IVW) has 335 stocks. If there were are 200 advances and 135 declines, then the difference would be +135 (335 – 200 = +135) and this would be added to the cumulative AD Line. The chart below shows the AD Line for the six different style ETF's.
Despite the decline over the last few weeks, the AD Lines for two styles are holding up a lot better than the other four. Notice that the AD Lines representing large-value and mid-value are holding well above their May lows (green arrows). Conversely, the AD Lines for large-growth and mid-growth moved below their May lows and remain the weakest of the six (red arrows). Small-growth and small-value are holding above their May lows for now, but are quite close to these important support levels and clearly weaker than large-value and mid-value. Even though the overall market may decline, these AD Lines suggest that large-value and mid-value will outperform (advance more or decline less) than the other four styles over the next few weeks and months.