ChartWatchers October 16, 2004 at 10:05 PM
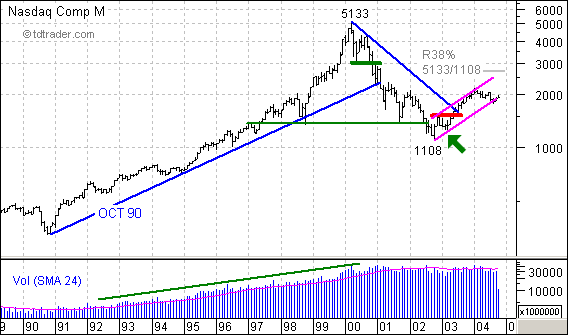
Monthly charts are good for perspective and some projections. First, you can see that both volume and the index steadily advanced from 1991 to 2000. Volume has leveled out over the last 4-5 years, while the index suffered a sharp decline to 1108... Read More
ChartWatchers October 16, 2004 at 10:04 PM
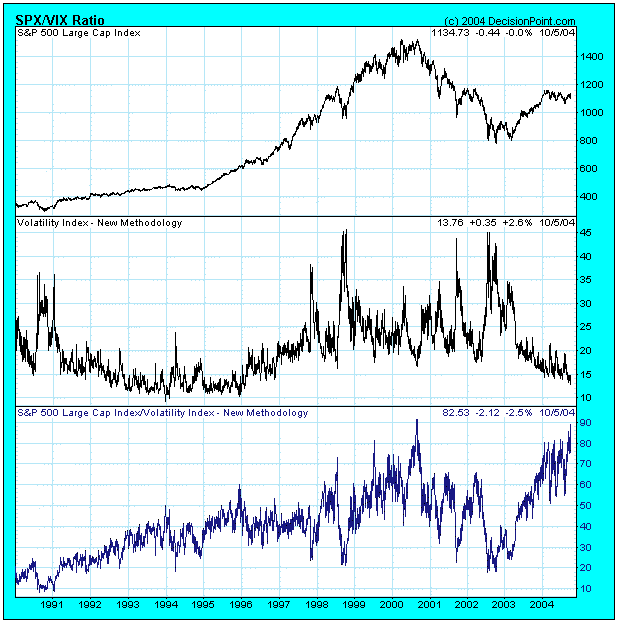
An indicator that has recently become quite popular is the SPX/VIX Ratio. I have tried to convince two of its proponents that it is a calculation that makes no sense, but to no avail. Nevertheless, I will present my argument here for your assessment... Read More
ChartWatchers October 16, 2004 at 10:03 PM
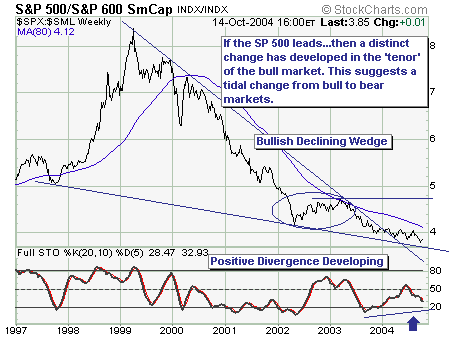
For all intents and purposes, the cyclical bull market that began in March-2003; and during the entire move to higher prices - S&P 500 Large Cap index performance 'lagged' that of the S&P 600 Small Cap index... Read More
ChartWatchers October 16, 2004 at 10:01 PM
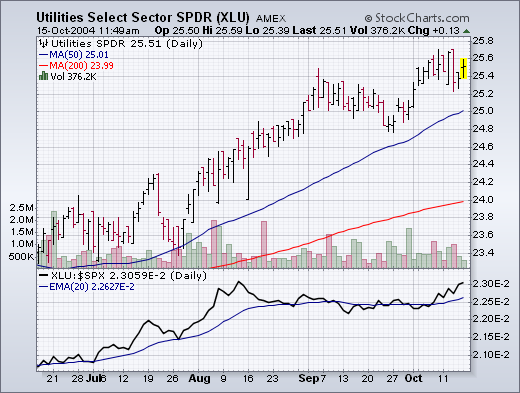
The biggest market feature of the week was the fact that Energy and Materials were the two weakest sectors. This is a reversal of recent trends. The loss of leadership by those two former leaders contributed to this week's market selling... Read More
ChartWatchers October 16, 2004 at 10:00 PM
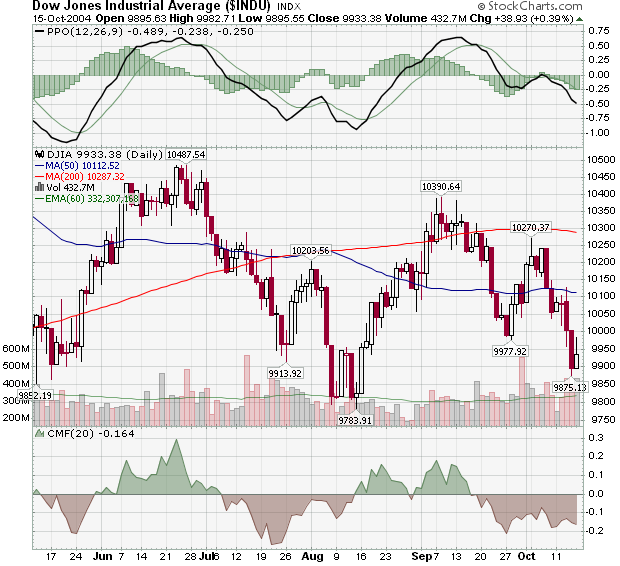
Last time we talked (on October 2nd) there was reason for optimism with the Dow. Oh, how times have changed... Unfortunately for the bulls, the promising uptrend that was created by the trough at 9,977 didn't fully materialize... Read More
ChartWatchers October 02, 2004 at 10:05 PM
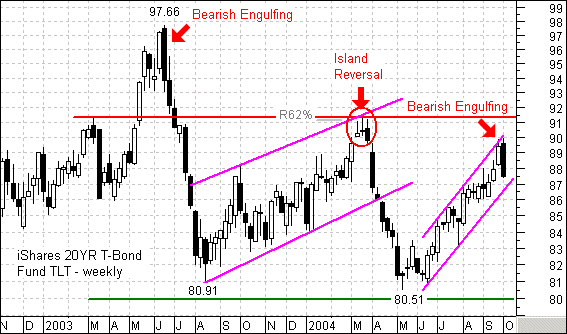
It's beginning to look like déjà vu all over again for the iShares Lehman 20+ Year T-Bond Fund (TLT). This bond ETF has been in a steady uptrend 20+ since May as rates have fallen. May just happens to coincide with the Fed's first interest rate hike... Read More
ChartWatchers October 02, 2004 at 10:04 PM
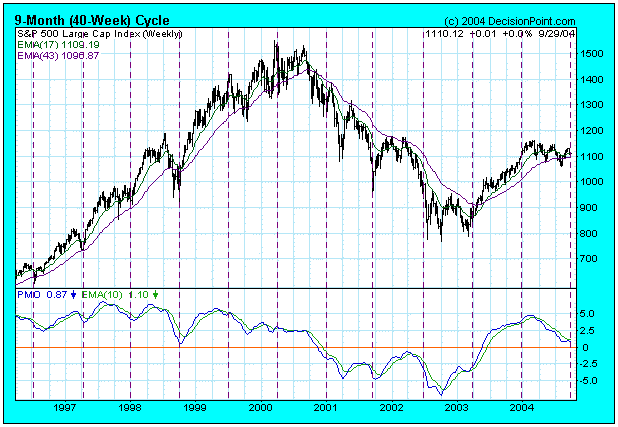
We are currently expecting a price low associated with the 9-Month (40-Week) Cycle, but let's first review some cycle basics. The vertical lines show the location of all Nominal 9-Month Cycle troughs since 1996... Read More
ChartWatchers October 02, 2004 at 10:03 PM
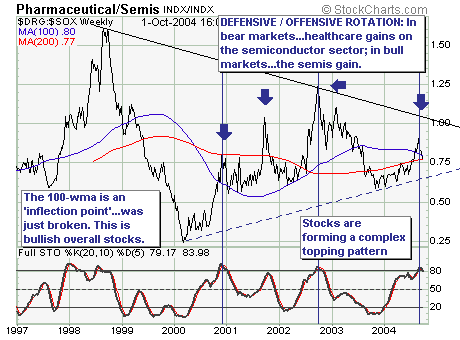
Our comments will be quite short and to the point: In bull markets the more �aggressive' semiconductor sector leads the more �defensive' healthcare sector as market participants favor stocks with higher �betas' in order to increase performance... Read More
ChartWatchers October 02, 2004 at 10:02 PM
NEW BOOKSTORE SECTION - We just started a BARGAIN BOOKS section in our bookstore. You will find a number of good books on charting and analysis at great discounts. You will always find books that are discounted at least 45% from their retail price... Read More
ChartWatchers October 02, 2004 at 10:01 PM
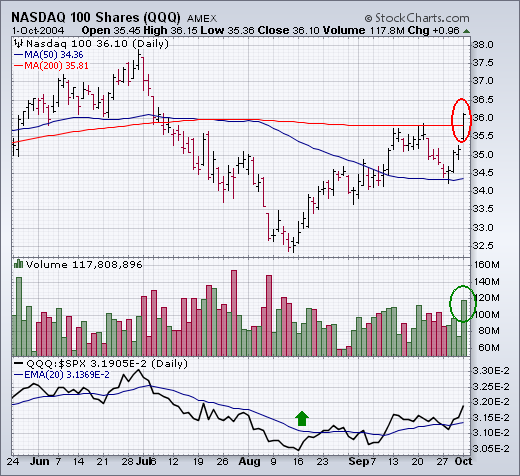
NASDAQ 100 TOPS 200-DAY LINE... One theme I keep repeating is the need for Nasdaq leadership during any fourth quarter rally... Read More
ChartWatchers October 02, 2004 at 10:00 PM
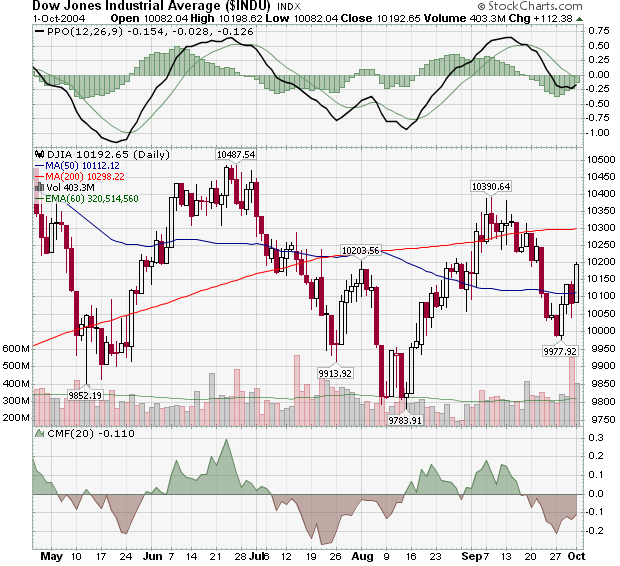
There's some good news on the Dow chart this week. Despite Thursday's Merck-induced dip, the index moved higher on Friday and solidified last Tuesday's reversal at the 9977 level... Read More