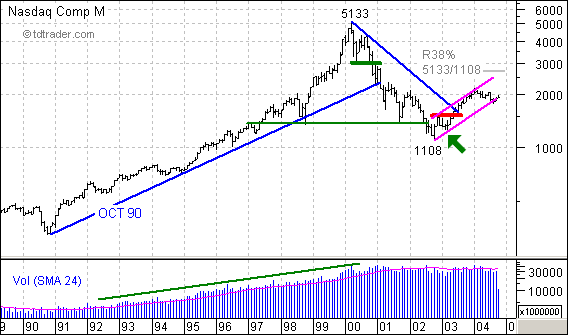
Monthly charts are good for perspective and some projections. First, you can see that both volume and the index steadily advanced from 1991 to 2000. Volume has leveled out over the last 4-5 years, while the index suffered a sharp decline to 1108. The recovery over the last two years carried the index back above 2000 and retraced a mere 25% of the prior decline.
Over the last nine months, the Nasdaq basically consolidated around 2000 and traded over to the lower trendline of the rising price channel. It looked as if this trendline was going to be broken in August, but the index managed to stave off the break and keep the channel alive (not sure about the kicking part).
Two things are clear. First, the last reaction low was at 1253 in Mar-03 (green arrow). The low came about with the breakout above resistance (red
line) in May-03. Second, the decline in 2004 is relatively puny compared to the prior advance (1108 to 2153). In fact, it looks like a mild correction or falling consolidation.
As a falling flag, a break above the June high (2056) would signal a continuation higher and project a move towards the upper trendline and 38% retracement. However, further weakness below the August low would break the trendline extending up from 1108 and call for a continuation of the prior decline (5133 to 1108). Gulp.