It's beginning to look like déjà vu all over again for the iShares Lehman 20+ Year T-Bond Fund (TLT). This bond ETF has been in a steady uptrend 20+ since May as rates have fallen. May just happens to coincide with the Fed's first interest rate hike. Rates have risen at the short end of the curve (<2 years), but declined at the long end and TLT represents the long end (>10 years).
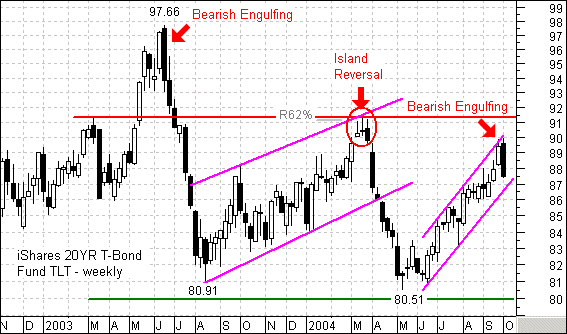
As noted in last week's report, TLT looks vulnerable to a pullback, consolidation or even a sudden reversal. This bond ETF traded to the upper trendline of a rising price channel and formed a bearish engulfing this week. Notice that a large bearish engulfing pattern foreshadowed the Jun-03 peak and an island reversal foreshadowed the May-04 reversal.
As the recent past shows, TLT can fall fast and the employment report is due next Friday. The last two declines erased 15% and 12 % in around two months (16-Jun-03 to 14-Aug-03 and 17-Mar-04 to 13-May-04). These are big moves for bonds and it was difficult to get out of the way as a virtual free fall occurred. Weak employment numbers and a softening economy have propped up TLT for the last few months. Recent GDP numbers show a firm economy and a strong employment report would surely send TLT tumbling further.