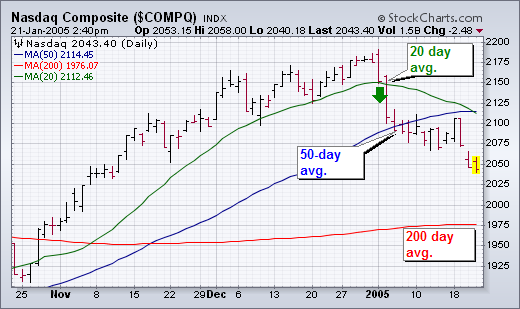
The 20-day average is usually too short for my purposes which is to spot bigger trend changes (although it is the period used in Bollinger Bands). At the same time, the 200-day average is too long. Imagine holding a long position in the market waiting to see if it breaks the 200-day average. The chart below shows that the Nasdaq would have to drop more than 200 points (10%) to give a sell signal. That's too much to give up in my opinion. That's why I rely most heavily on the 50-day average. One of the simple rules that I follow is to require that any sector, industry group, or stock that I'm recommending close over its 50-day average. At the same time, I consider selling anything that closes under its 50-day line. There are some conditions that I look for to confirm a downside break. The market has to "close" beneath the 50-day line and in decisive fashion. Then it has to "stay" under it. Very often a market will attempt to climb back over its 50-day line. If it fails that attempt, that's another bearish sign. I also watch the "Friday" close. That's because a Friday close determines where a market ends on a weekly bar chart. [On a weekly chart, the 50-day average is converted to a 10-week average]. A Friday close beneath a moving average is more serious than a mid-week violation. That's even more true of the 200-day (or 40-week) moving average. In the chart below, the Nasdaq closed under its 50-day line on Wednesday, January 5 and remained beneath it through the end of the week. It never did close back above it. That's negative action -- and a pretty good reason to have considered doing some selling of longs (or initiating new shorts).