To understand the Nasdaq and Nasdaq 100, it is important to look at the individual parts. These two indices can be broken down into four key industry groups: semiconductors (SMH), networking (IGN), software (SWH) and internet (HHH). While retail, telecom, hardware, biotech and other industry groups certainly play a part, these four are the key drivers and the first place to look for signs of weakness or strength.
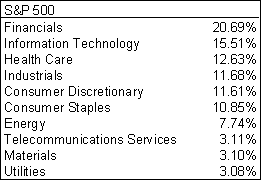
The same approach works for the S&P 500. This index can be broken down into six key sectors: Finance (XLF), HealthCare (XLV), Consumer Discretionary (XLY), Information Technology (XLK), Industrials (XLI) and Consumer Staples (XLP). Even though Industrials and Consumer Staples each make up over 10% of the index, I tend to focus on the other four sectors, which make up over 60% of the index when combined.
In particular, the retail group is a major influence on the Consumer Discretionary sector and retail spending drives ~2/3 of GDP. As it name implies, the Consumer Discretionary sector represents cyclical stocks and these are more prone to economic fluctuations than the other sectors. This makes it an important component of the S&P 500. And finally, notice that Energy, Materials and Utilities (combined) account for less than 15% of the index. However, their influence is growing.