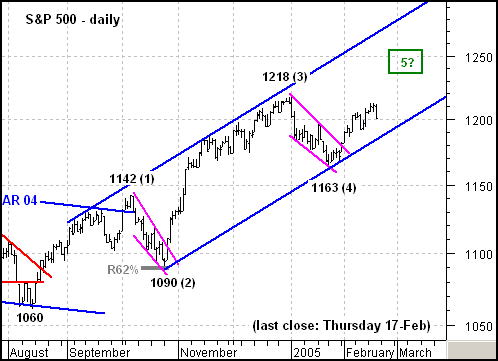
The S&P 500 remains in bull mode and continues to outperform the Nasdaq 100. In Elliott terms, the index has taken on a 5-Wave structure since mid August. Wave 1 extends up to 1142, Wave 2 declined to 1090, Wave 3 advanced to 1218 and Wave 4 fell to 1163. The recent move above the upper trendline of the falling wedge represents the beginning of Wave 5.
As a Wave 5 advance, the upside projection would be to around 1240-1245. Wave 5 is often 62 percent of Wave 3 or equal to Wave 1. The 62% stems from the Fibonacci number .618. As a Fibonacci 62% of Wave 3, the upside target would be to 1242 (1218 – 1090 = 128, 128 x .62 = 79, 1163 + 79 = 1242). Should a repeat of Wave 1 occur, the upside target would be to 1245 (1142 – 1060 = 82, 1163 + 82 = 1245).
Regardless of the targets, Wave 5 should move above the high of Wave 3 (1218). As long as the blue trendline extending up from the late October low holds, the bull trend is firmly in place and further strength should be expected.