At the New York Expo last weekend, Martin Pring made the case that the battle between the forces of deflation and inflation had reached a critical inflection point. In other words, his charts showed that the deflation/inflation scale was about ready to tip in one direction. He arrived at that conclusion by comparing rate-sensitive (deflation) stocks with commodity-related (inflation) stocks. When rate-sensitive stocks are in the lead, deflation is dominant. When commodity-stocks lead, inflation is dominant (or becoming so). Which brings me to our last chart. It's a ratio comparison of basic material stocks to financials. With long-term rates rising this week, and inflation and commodity prices picking up, the week's strongest sectors were basic materials and energy. The weakest sector was financials. The chart below is a ratio of the Materials ETF (XLB) divided by the Financials ETF (XLF).
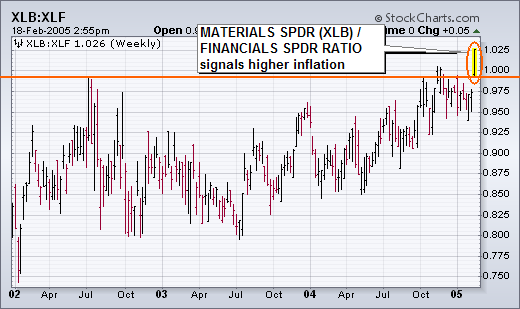
MATERIALS/FINANCIALS RATIO TURNS UP ... The fact that the ratio has been trading sideways for almost two years shows that deflation/inflation forces have been pretty evenly balanced (as the Fed has been pointing out). This week, however, the XLB/XLF ratio broke out to the highest level in three years. That tells me that the scale has finally tipped in favor of inflation. If inflation is no longer contained (as the Fed has claimed) it may have to abandon its "measured pace" and raise short-term rates faster and longer than it had planned to. Rising inflation expectations could boost long-term rates. All of these trends have important implications for investors. For one thing, it'll be better to be in inflation-sensitive stocks (like basic materials) than deflation-sensitive stocks (like financials). It also hints at higher interest rates -- both short and long. All of which seems to strengthen my negative view on the stock market and my preference for cash, commodity-related stocks, and defensive stock groups in general.
