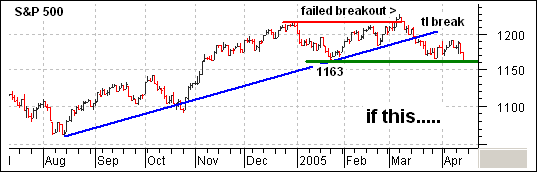
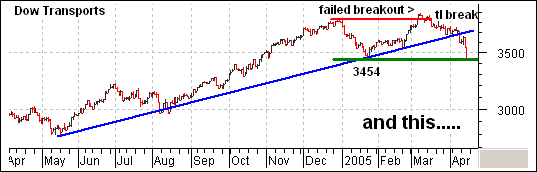
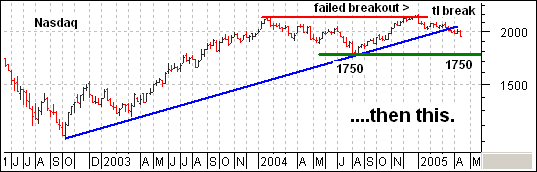
The current pattern at work in the Nasdaq looks quite similar to prior patterns for the S&P 500 and Dow Transports. Both of these indices had extended advances, failed to hold a breakout to new highs, broke trendline support and then continued to support from the prior low (1163 and 3454). In fact, the S&P 500 and the Dow Transports continued lower on Friday and broke below their prior lows. The patterns looks like large double tops and the support breaks are quite bearish.
Turning to the Nasdaq, we can see that a similar scenario projects a move to around 1750. This would also make for a large double top and a break below 1750 would further the bearish argument.

About the author:
Chip Anderson is the founder and president of StockCharts.com.
He founded the company after working as a Windows developer and corporate consultant at Microsoft from 1987 to 1997.
Since 1999, Chip has guided the growth and development of StockCharts.com into a trusted financial enterprise and highly-valued resource in the industry.
In this blog, Chip shares his tips and tricks on how to maximize the tools and resources available at StockCharts.com, and provides updates about new features or additions to the site.
Learn More