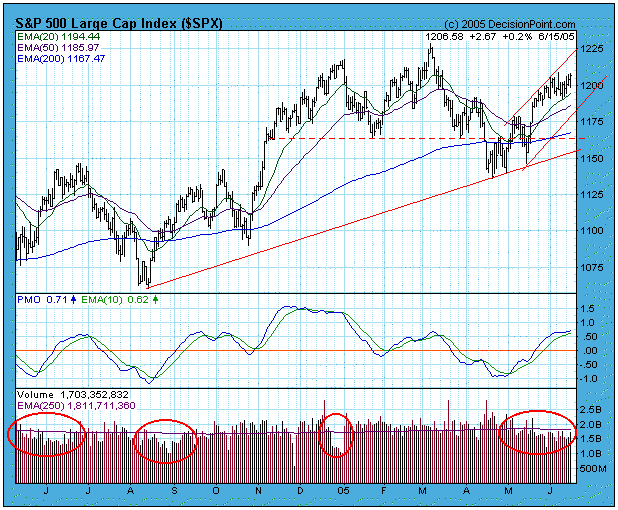
While persistently rising prices are frustrating the bears and encouraging the bulls, there is evidence that distribution is taking place.
On the first chart I have circled areas where daily volume has scooped below its 250-EMA line, indicating that there was inadequate sponsorship of the rising trend. In each of the first three cases shallow volume preceded price corrections. The current volume dip, which has lasted about six weeks, has yet to be resolved, but it seems reasonable to expect a correction fairly soon, probably starting soon after we see final expansion of volume.
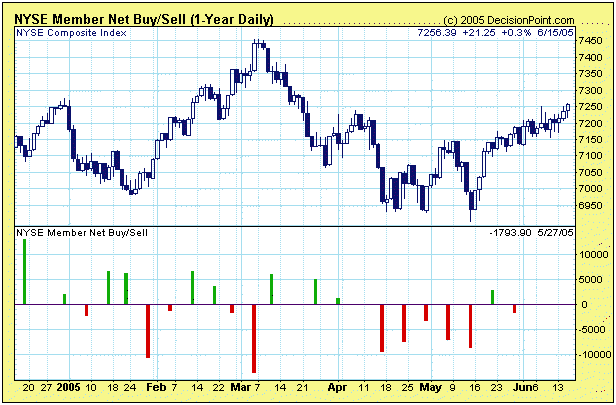
The second chart shows a five-week period of NYSE Member Net Selling, which is a fairly unusual because these insiders are normally accumulating shares into declines (shares that will be sold during the next advance). The NYSE delays reporting of these numbers by two weeks, so there is a big question mark as to what Members have been doing during the last three weeks; however, the large amount of net selling raises a red flag, especially when viewed in the context of the shallow volume problems discussed above.