ChartWatchers July 17, 2005 at 10:05 PM
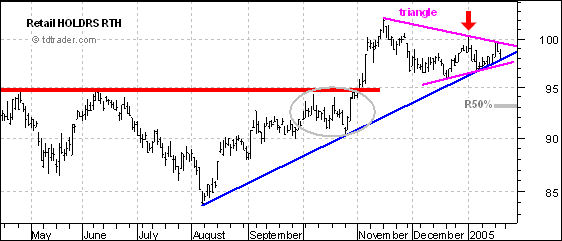
January and 2005 have not been good for the bulls. After a strong finish in 2004, stocks were hit with strong selling pressure to begin the year and have yet to recover. A look into November and December reveals early weakness in two key groups... Read More
ChartWatchers July 17, 2005 at 10:04 PM
The Equity and OEX Put/Call Ratios generally signal overbought and oversold conditions that help identify price tops and bottoms; however, sometimes the OEX Put/Call Ratio will invert relative to the Equity Put/Call Ratio... Read More
ChartWatchers July 17, 2005 at 10:03 PM
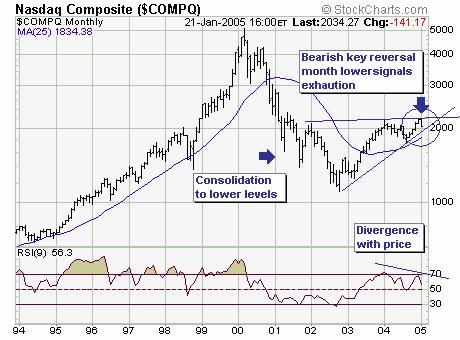
The January decline to date is gaining in importance; if prices remain at current to lower levels through the next six trading sessions – then a bearish 'key reversal month' will form... Read More
ChartWatchers July 17, 2005 at 10:01 PM

A few weeks back I wrote about the close linkage between the Dow Transports and Industrials. At the time, both were threatening their spring lows. Now both are testing their June highs (see first chart)... Read More
ChartWatchers July 17, 2005 at 10:00 PM
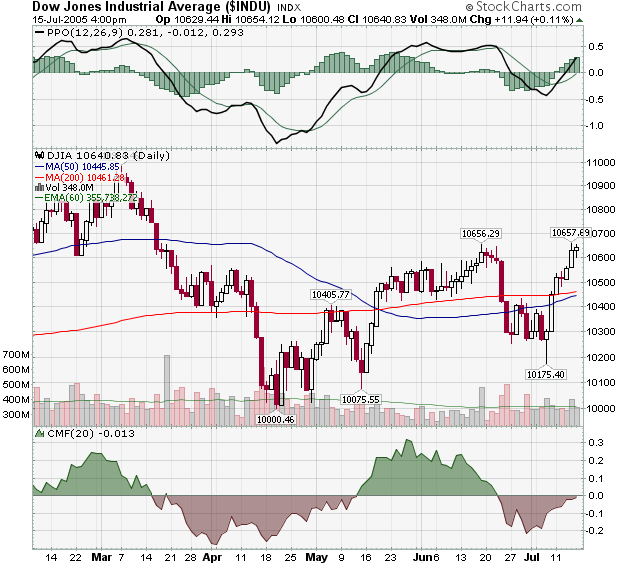
The market battled back impressively over the past week and a half and is re-testing the 10,600 resistance level that gave it so much trouble in mid-June (and May and late March)... Read More
ChartWatchers July 03, 2005 at 10:05 PM
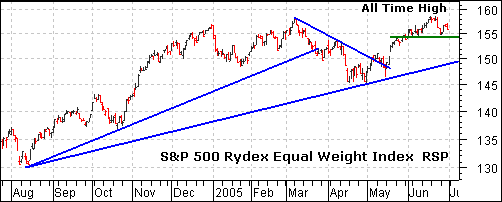
The Rydex Equal Weight S&P 500 Index (RSP) moved to a new all time high last week. Strangely enough, the Energy SPDR (XLE) moved to a new all time high two weeks ago. It is clear that Energy stocks have the best of both worlds: rising demand and rising prices... Read More
ChartWatchers July 03, 2005 at 10:04 PM
A good measure of market participation -- the number of stocks participating in upside price moves -- is the percentage of stocks above their 200-day moving average. DecisionPoint... Read More
ChartWatchers July 03, 2005 at 10:03 PM
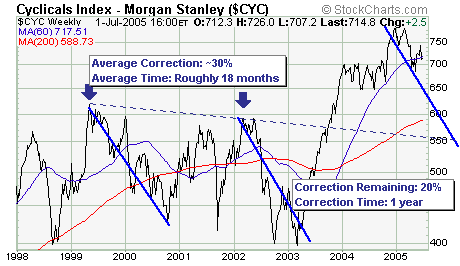
The MS Cyclical Index ($CYC) is quite interest rate sensitive; and thus prone to large corrections witness the past 7 year history of which there are two very distinct 30% corrections... Read More
ChartWatchers July 03, 2005 at 10:02 PM
ANOTHER NEW BOOK IN OUR BOOKSTORE - Investing in a Secular Bear Market by Michael Alexander This is the sequel to his 2000 book, Stock Cycles, which forecast the start of this secular bear market... Read More
ChartWatchers July 03, 2005 at 10:01 PM
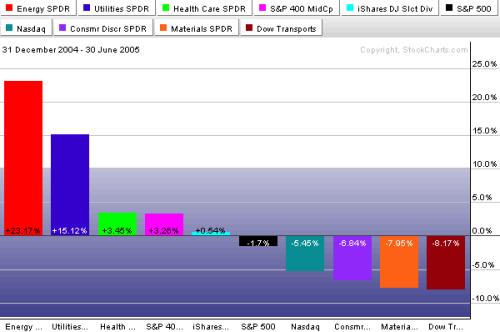
The bars in the following chart show the best and worst group performers for the first half of the year. To no one's surprise, energy was the top sector -- while the fuel-sensitive transports were the weakest. Utilities took second place thanks to falling bond yields... Read More
ChartWatchers July 03, 2005 at 10:00 PM
The market erased the gains that we highlighted in our previous newsletter in one day as the 10,600 level on the Dow proved once again that it is an important level for the market. This week's big news of course was the Fed's rate hike... Read More