The market battled back impressively over the past week and a half and is re-testing the 10,600 resistance level that gave it so much trouble in mid-June (and May and late March).
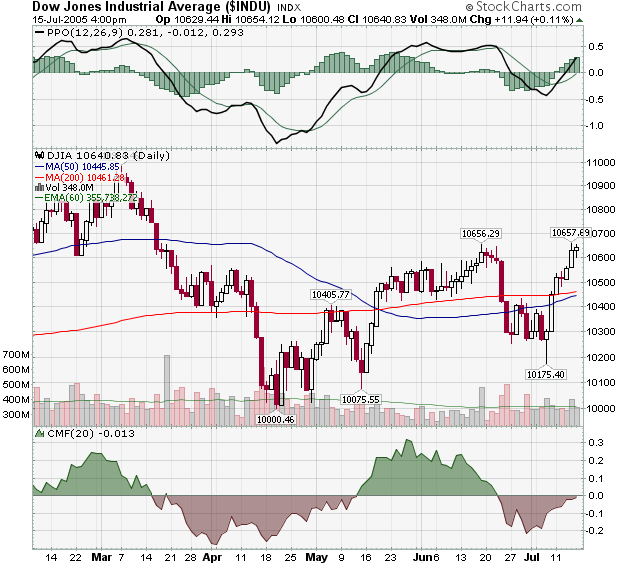
With the CMF poised to move into positive territory, the PPO already positive, and the 50-day MA about to move above the 200-day MA, the technical signals look pretty good right now, but here's where Technical Analysis becomes more of an art than a science. Notice that on Friday, the Dow failed to climb above the high that it set on Thursday. Also note that Friday's volume was slightly below average. Experienced chart watchers know that those can be early warning signs that the current rally is fading, especially if those signs appear near an important resistance level. Because of that, my gut says that its time for a pull-back. Watch the markets closely on Monday to see if my gut or the technical indicators are correct!
