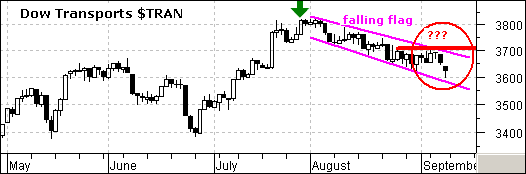
Dow Theory stipulates that the Dow Industrials and Dow Transports should confirm each other to validate weakness or strength. Most recently, both Averages recorded new reaction highs in late July (green arrows) and this provided a Dow Theory confirmation of strength. Both Averages corrected in August, but only one surged in September.
The Dow Transports formed a falling flag correction in August. The only problem, for the bulls at least, was the inability of the Average to break the fall, exceed resistance at 3706 and signal a continuation higher. The flag just kept on falling and the Average gapped down on Friday.
In contrast to the Dow Transports, the Dow Industrials firmed around 10400 with a couple of bullish candlestick reversal patterns and surged above 10600 with a big move over the last four days. Wednesday's long white candlestick is enough to confirm the prior bullish engulfing (30-31 Aug) and turn the Dow Industrials short-term bullish.
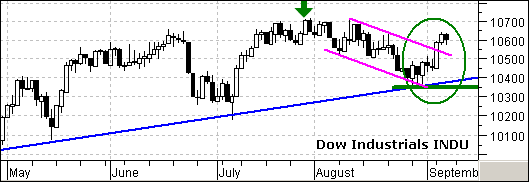
The Dow Industrials surged and the Dow Transports sank – something is wrong with this picture. This amounts to a non-confirmation of strength in the Dow Industrials. The Dow Transports need to break resistance at 3706 to get the Dow Theory bull back on track. Without confirmation from this economically sensitive group, the breakout in the Dow Industrials is prone to failure.
