Wow! Six years into the new millennium already - and into StockCharts.com's seventh year of existence! Last year was our strongest year ever as we continued to expand our site and our subscribership. This year looks even brighter with the upcoming release of SharpCharts2 and our long-awaited streaming chart tool.
Speaking of which, the final Beta release of SharpCharts2 - Beta 7 - will be out on February 1st. With greatly expanded control over overlays and colors, as well as the ability for members to store charts into their accounts, SharpCharts 2 Beta 7 will be another major milestone in our quest to provide the very best charts on the Internet.
Meanwhile, the markets have remained busy, in part because of the current state of the Yield Curve. Depending on who you talk to, the Yield Curve is either inverted or very close to it. In lieu of those developments, we recently updated our Dynamic Yield Curve tool to include several additional bond yield datasets. Here's a snapshot of the new version which shows the additional data and the flat/inverted state of affairs:
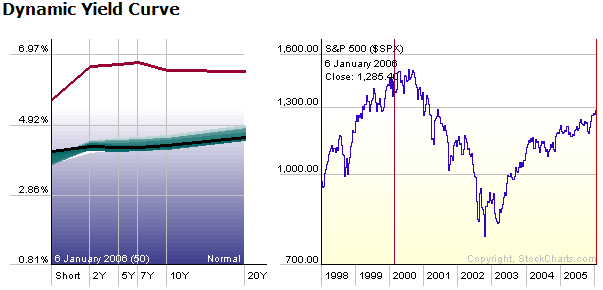
The black line is the current yield curve. The blue-green "trails" behind it show what it has looked like during the previous 50 trading days. Notice that the middle of the yield curve is very flat (possibly dipping slightly)? That is the possible inversion that people are talking about.
Why is that so important? Check out the red line at the top of the chart. That is what the yield curve looked like back in early 2000 - the last time the yield curve inverted. Notice that the yield curve inverted just before the market peaked (see the red vertical line on the S&P chart?). So, is the yield curve now signaling another market downturn? That's what everyone is concerned about.
