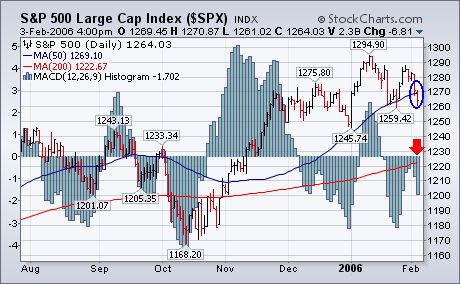
The chart below shows the S&P 500 closing the week below its 50-day moving average. That suggests a further drop toward 1245. The daily MACD histogram bars also paint a short-term negative picture. They stayed below the zero line and failed to confirm the previous week's price bounce before weakening even further this week. That only affects the short-term trend. It's the weekly trend that I'm more concerned about.

About the author:
Chip Anderson is the founder and president of StockCharts.com.
He founded the company after working as a Windows developer and corporate consultant at Microsoft from 1987 to 1997.
Since 1999, Chip has guided the growth and development of StockCharts.com into a trusted financial enterprise and highly-valued resource in the industry.
In this blog, Chip shares his tips and tricks on how to maximize the tools and resources available at StockCharts.com, and provides updates about new features or additions to the site.
Learn More