The dark cloud is a bearish candlestick reversal pattern made up of two candlesticks. The first is white and the second black. The open of the second is above the close of the first and the close of the second is below the mid point of the body of the first. The open-close range forms the body of the white candlestick. The thin lines above and below the body are called shadows and these represent the high and low.
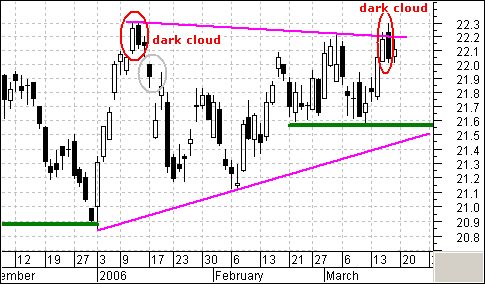
A dark cloud foreshadowed the January peak and this week�s dark cloud should be watched closely for confirmation. In January, the subsequent gap and move below 22 confirmed the dark cloud pattern (gray oval). The current dark cloud formed near the upper trendline of a triangle formation (magenta trendlines). There is stiff resistance around 22.3 and XLK must break through this level to confirm the triangle and project further strength towards the mid 20�s. This would be bullish for the Nasdaq and the S&P 500 as well. Failure and a move below the early March lows would be bearish for XLK and I would then expect a move below the January low.
