Last week I wrote an article entitled Investors Intelligence Sentiment Helps Bulls in which I pointed out that sentiment had become very bearish, and that the market was more likely to rally than decline. Since then the market has enjoyed a short rally, but sentiment continues to be steadfastly bearish, a persistent positive for the market; however, the market has become short-term overbought and it has run into long-term resistance.
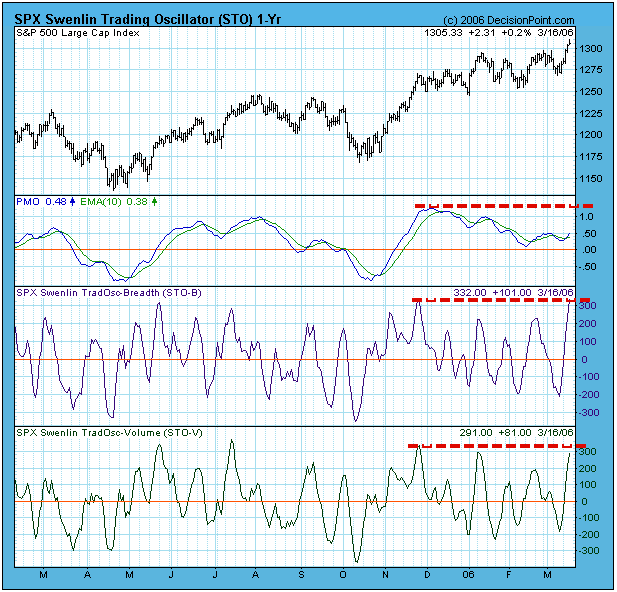
The bottom two panels on the first chart show the breadth and volume versions of the Swenlin Trading Oscillator (STO) -- short-term indicators. As you can see, both indicators have reached the overbought side of their range. This condition needs to be relieved, but this could happen without a price decline -- as you can see in May and July of last year the indicators dropped toward zero while prices continued higher. Could this happen again this time? Let's look at a longer time frame.

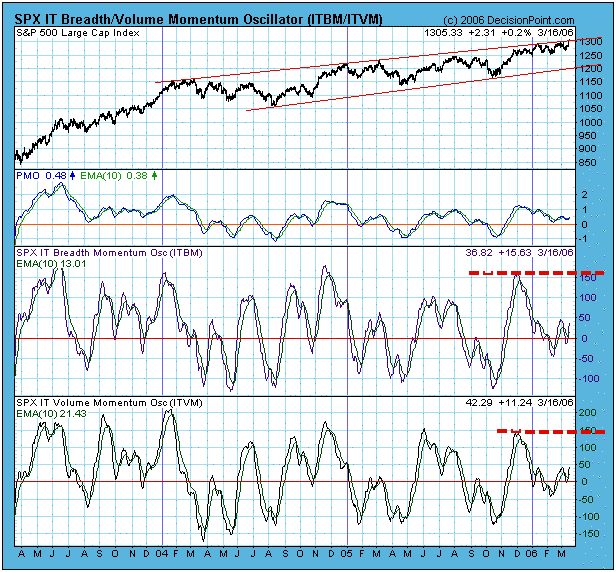
The chart below shows our intermediate-term indicators -- the PMO (Price Momentum Oscillator), as well as the ITBM (IT Breadth Momentum) and ITVM (IT Volume Momentum) Oscillators. They are all in the neutral zone, and have a long way to go before they reach overbought levels, so there is plenty of room internally for prices to move higher. By the same token, there is also plenty of room for them to move lower, but they are not currently acting as if they want to go in that direction.

Finally, let's look at the price index. We can see that it has been hugging the top of the rising trend channel for nearly four months, and it has just squeaked above the line of resistance. This is not a decisive breakout, but it is another manifestation of the persistent bullishness that prices have been displaying for quite a while.
Bottom Line: Our mechanical timing model has been bullish since November 4, 2005. Short-term indicators are overbought and problematic, but medium-term indicators, as well as sentiment, allow for a continued advance in prices for at least a few more weeks.
