ChartWatchers April 16, 2006 at 10:05 PM
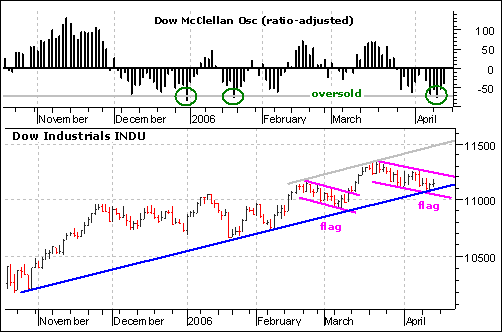
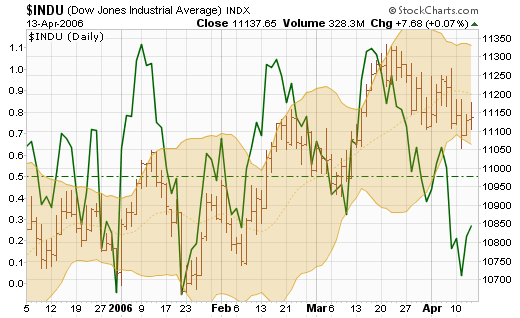
The decline in the Dow Industrials over the last few weeks looks like a bull flag. This downward sloping flag is a potentially bullish pattern that requires confirmation with an upside breakout. Notice that the Dow formed a similar falling flag in late February and early March... Read More
ChartWatchers April 16, 2006 at 10:04 PM
One way we can gauge sentiment regarding a particular market or sector index is by watching asset levels and/or cumulative net cash flow in and out of the related Rydex mutual fund. In general, cash flows should rise and fall along with prices... Read More
ChartWatchers April 16, 2006 at 10:03 PM
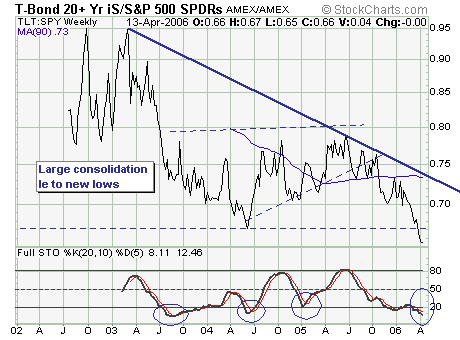
Last week the 10-year note and 30-year bond rose decidedly above the psychologically important 5.0% level. This is first time since June-2002 that the 10-year has traded above this level... Read More
ChartWatchers April 16, 2006 at 10:02 PM
SHARPCHARTS2 PROGRESS REPORT - SharpCharts2 took another huge step forward last week when all of our "Basic" subscribers were automatically converted to the new system... Read More
ChartWatchers April 16, 2006 at 10:01 PM
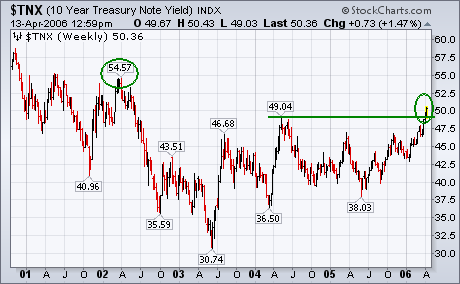
Last week the yield on the 10-Year T-note broke through its 2004 peak at 4.90% to reach the highest level in four years. Today the TNX has moved through the psychological level of 5%... Read More
ChartWatchers April 16, 2006 at 10:00 PM
MAKING MONEY WITH SHARPCHARTS2 This week - tax week (ugh!) - I wanted to show you three examples of the kind of analysis that you can only do with SharpCharts2. These examples illustrate important technical analysis techniques that just weren't possible with our older charts... Read More
ChartWatchers April 01, 2006 at 11:05 PM
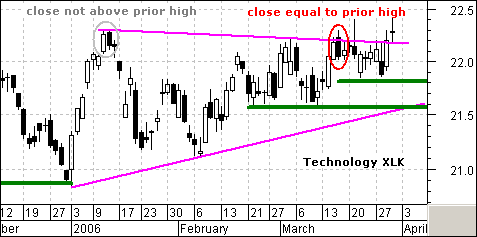
In my previous column, I featured the Information Technology SPDR (XLK) with a pair of Dark Cloud Cover reversal patterns... Read More
ChartWatchers April 01, 2006 at 11:04 PM
The overall trend of the market is still up, but there are very few new opportunities surfacing... Read More
ChartWatchers April 01, 2006 at 11:03 PM
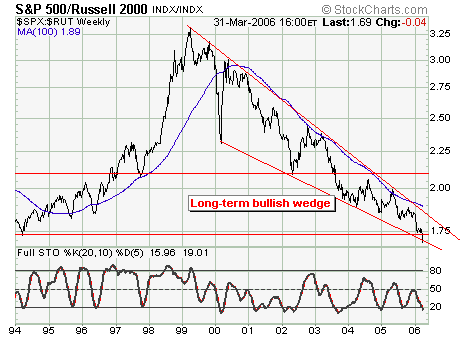
Today we look at large cap vs. small cap stock via the S&P 500/Russell 2000 Ratio. Since 1999, the ratio has gone nowhere other than down; which means this is the 8th year of decline... Read More
ChartWatchers April 01, 2006 at 11:02 PM
BASIC MEMBERS, SHARPCHARTS2 CONVERSION LATER THIS WEEK! - If you are a member of our "Basic" charting service, get ready. We plan on converting our Basic members to our SharpCharts2 charts during the coming week. ALL OF YOUR SAVED CHARTS WILL BE AUTOMATICALLY CONVERTED FOR YOU... Read More
ChartWatchers April 01, 2006 at 11:01 PM
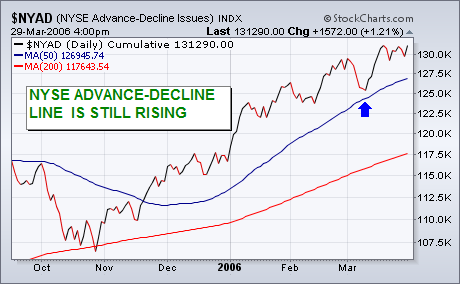
Rising interest rates can help the stock market over the short- to intermediate-term because it implies economic strength. It also causes some money to rotate out of falling bond prices and into stocks... Read More
ChartWatchers April 01, 2006 at 11:00 PM
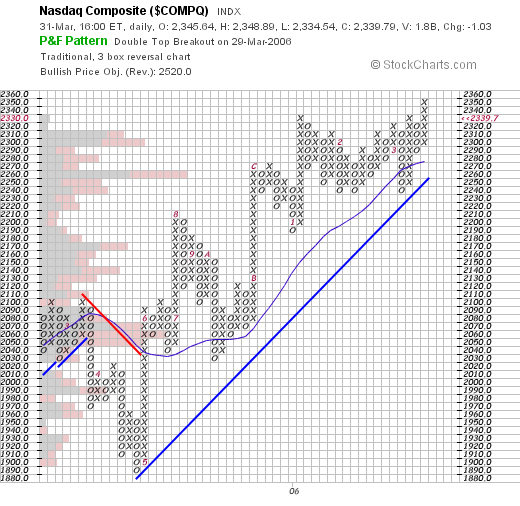
NADAQ BREAKSOUT - P&F CHART SHOWS IT BEST Last week the Nasdaq composite broke through the 2340 resistance level and has moved into territory not seen since the "bubble popped" back in early 2001... Read More