NADAQ BREAKSOUT - P&F CHART SHOWS IT BEST
Last week the Nasdaq composite broke through the 2340 resistance level and has moved into territory not seen since the "bubble popped" back in early 2001. The mid-term significance of this development can best be seen on the following P&F chart:
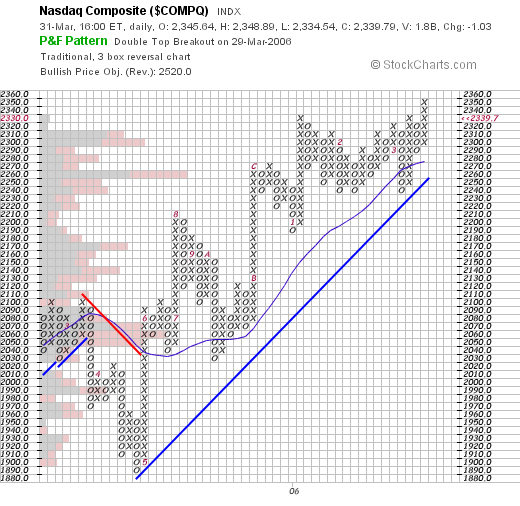
Notice how the right-most column of rising X's has moved higher than the column of X's that appeared at the start of 2006? That "Double Top" breakout is what all of the fuss is about. By moving above the 2350 mark briefly on Thursday, the Nasdaq caused the uppermost X to appear confirming the double top pattern. As long as the index stays above the 2330 level, the pattern will remain intact.
(For more on P&F charts and P&F patterns, please see our ChartSchool article on the topic. While they might look strange at first, P&F Charts are invaluable for understand the major trends and patterns for an stock or index.)
In addition, notice three other bullish developments on this chart:
1.) The long-term trendline is coming into play now and should provide upward support soon. (P&F trendlines are always at 45-degrees).
2.) The 20-column MA is also starting to provide some support.
3.) The Price-by-Volume histogram shows lots of "up" (black) buying at the 2310 and 2320 levels - a good indication that a strong support area has formed there.
Are there warning signs to go along with this rosy picture? Of course. The Fed continues to raise interest rates. Depending on who you talk to, the yield curve is either flat or inverted. The large-cap indices are showing signs of weakness. Etc.
But it sure feels good to have the Nasdaq back and setting the pace again, even if it is only for a little while.
