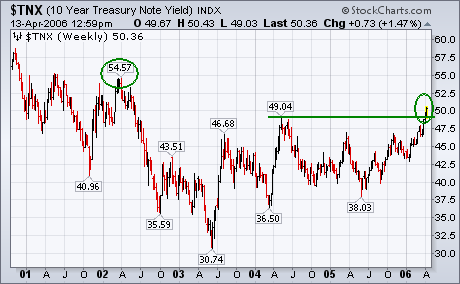
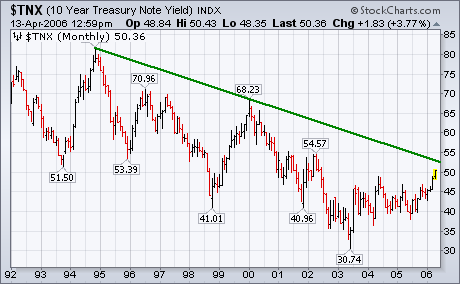
Last week the yield on the 10-Year T-note broke through its 2004 peak at 4.90% to reach the highest level in four years. Today the TNX has moved through the psychological level of 5%. That doesn't come as much of a surprise considering that the trend for bond yields is now higher. I suggested last week that the next upside target for the TNX was the early 2002 peak at 5.45%. While I remain convinced that bond yields have embarked on a new uptrend, there's still another technical hurdle that they have to overcome to prove that the long-term downtrend in long-term rates has finally ended. The monthly bars in Chart 2 show the downtrend in yields from the 1994 peak. I've drawn a down trendline over the 1994 and early 2000 peaks. Needless to say, a move above that resistance line would be the final sign that the era of long long-term rates has finally ended. The most immediate result of rising bond yields is falling bond prices.