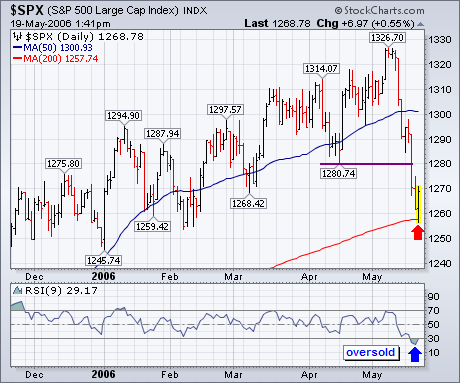
Although the longer-range chart picture has weakened (with most weekly indicators on sell signals), the S&P 500 has lost about 5% this week and looks to be in a short-term oversold condition. Its daily chart shows the 9-day RSI line below 30 for the first time this year. In addition, the S&P has reached its 200-day moving average and potential chart support along its first quarter lows. That may be enough to cause a market rebound next week. If one does materialize, the first level of resistance would be at 1280 which would also be a one-third retracement of the recent selloff. That's also the mid-April low that was broken this week. Broken support levels often become new resistance levels. While short-term indicators are oversold, weekly indicators aren't. Since weekly indicators take precedence over daily ones, I would continue to view any short-term rally as another selling opportunity.