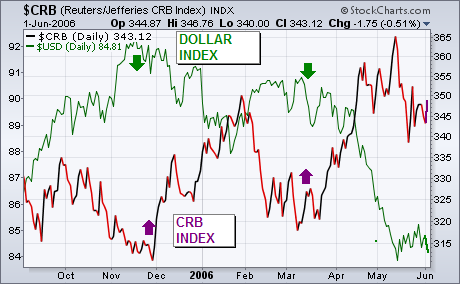
The chart below compares the Dollar Index (green line) to the CRB Index (purple line) since last September. The main message to be drawn from the chart is that the two markets have been trending in opposite directions which is their natural tendency. Dollar peaks last November and again in March coincided with CRB upturns. A dollar bounce during the first quarter coincided with a CRB selloff. The recent minor bounce in the dollar may have contributed to the recent slide in commodities. That's why commodity traders need to watch the dollar especially closely at this point. That's because the dollar is at a crucial chart juncture.
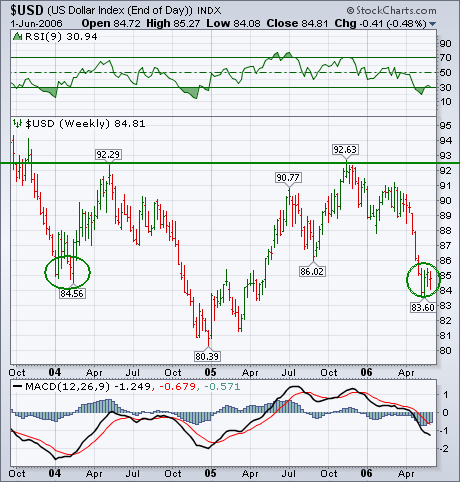
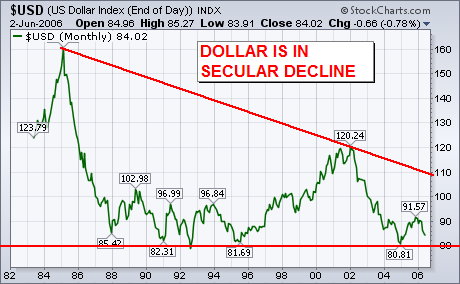
Back in March I wrote a column about a possible "head and shoulders" bottom being formed by the Dollar Index. The next chart is an updated look at that possible chart pattern. The horizontal line drawn over the 2005 peaks near 92 is a possible "neckline". The middle trough formed at the start of 2005 is a possible "head", while the early 2004 trough is a possible "left shoulder". If the current selloff is a "right shoulder", it shouldn't fall below the left shoulder. The two green circles show that level to be just above 84. The Dollar Index is testing that support level at the moment. To turn the chart pattern bullish, the USD would have to rally from this level and exceed its neckline at 92. It's a long way from doing that. If it doesn't hold near 84, it could drop all the way back to its early 2005 low near 80. Technical indicators are mixed. The 9-week RSI is in oversold territory under 30. But the weekly MACD lines are still negative. Since I'm a believer in the maxim that it's easier to continue a trend than to reverse one, I think odds favor a dollar move to the downside. That would be even more likely if today's weak jobs data encouraged to Fed to take a pause in June. That would be bullish for gold and other commodity markets. That's why a lot rides on the trend of the dollar. That's also why the final chart is so worrisome. Going back to the mid-1980's, it shows the dollar in a long-term secular decline. It also shows how important the support line is along the 80 level. It held at the start of 2005 and prevented a major breakdown. If the current level of 84 doesn't hold, that long-term support line at 80 will be threatened again.