ChartWatchers July 15, 2006 at 10:04 PM
While both the S&P 500 and Nasdaq 100 are showing the effects of the current correction, there are significant differences in the technical picture on both charts... Read More
ChartWatchers July 15, 2006 at 10:03 PM
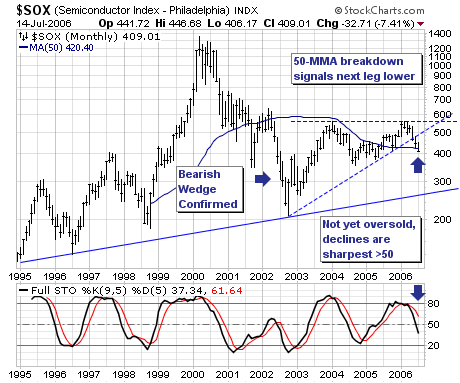
We believe that the Semiconductor Index (SOX) is poised to move sharply lower in the months ahead into a tradable bottom. Our target is rising trendline support near 280, which presupposes a decline of -31% between now and then... Read More
ChartWatchers July 15, 2006 at 10:02 PM
FIVE YEARS WITHOUT A PRICE INCREASE! - StockCharts.com introduced our "Extra" service five years ago and our price then was the same as it is now. StockCharts is still a great value folks... Read More
ChartWatchers July 15, 2006 at 10:01 PM
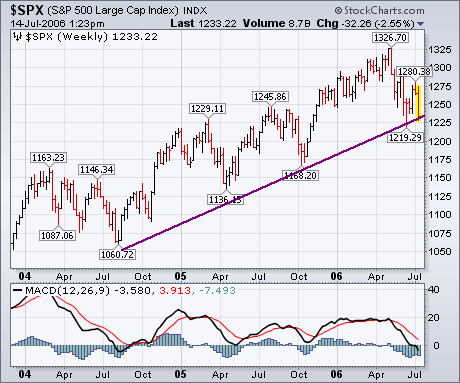
Earlier in the week I showed a number of moving averages that appeared to be on the verge of giving major sell signals. Here's another long-term support line to watch. The S&P 500 is bearing down on a two-year support line that starts in the summer of 2004... Read More
ChartWatchers July 15, 2006 at 10:00 PM
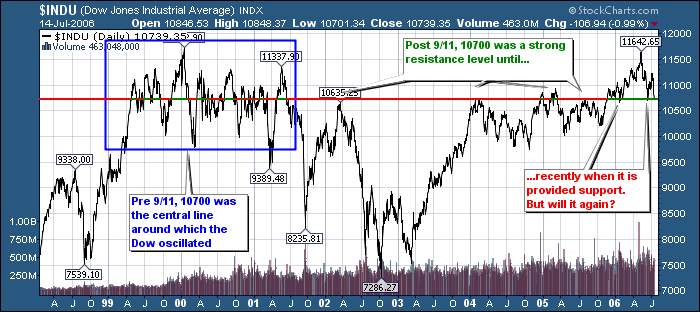
Three big down days have sent the Dow back down to the 10,700 support level. What's that you say? 10,700 is just a number? Just a number like any other? Oh really? Check out this chart: 10,700 is a number that should make your ears perk up... Read More